At the moment TeeChart Pro for VCL / FMX does not have a Series type available to create Activity Gauges, maybe in the near future, but here I will show how using another series type and some tricks we can create this kind of Chart.
The series type to use is the Donut series. We’ve to add as many Donut series as Activities we want on our chart.
I’m going to take advantage of the ease with which we can ask the TChart component to setup most of the steps at designtime, right from the Chart editor itself.
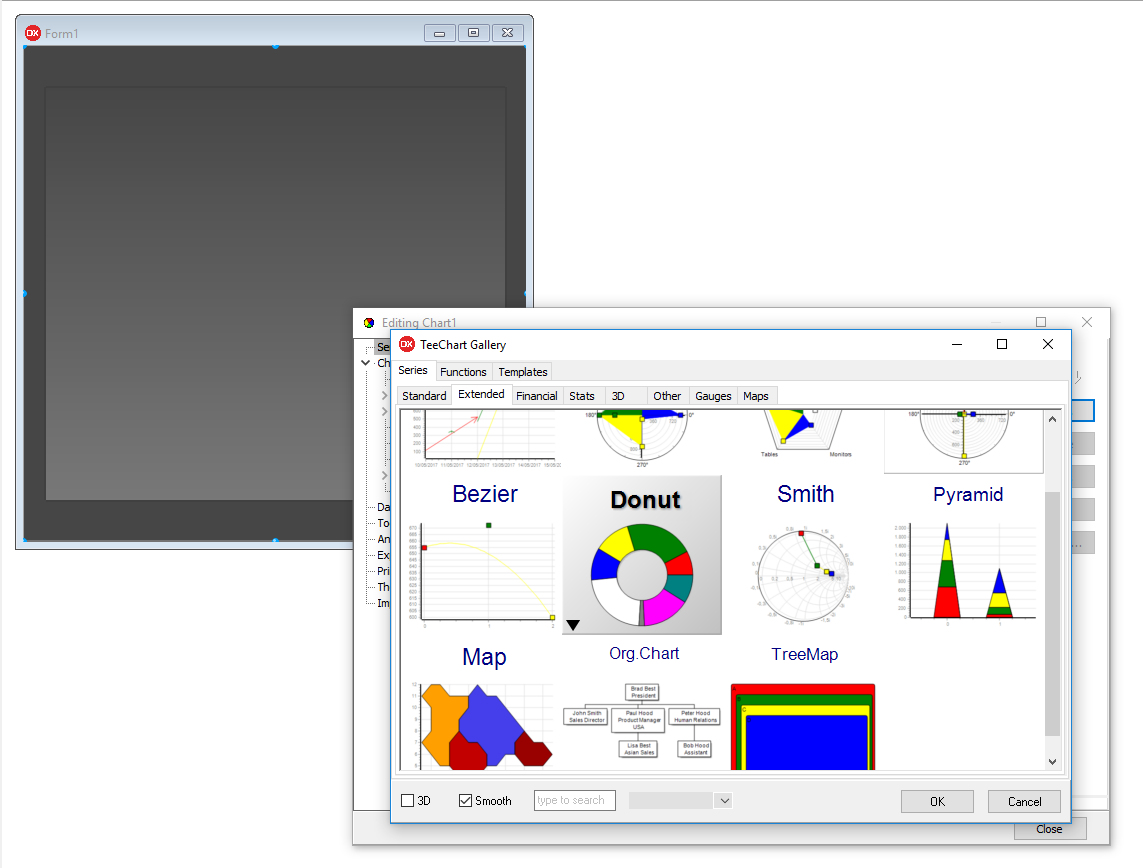
Once we have the Chart in the form and have added the different Donut Series, it doesn’t seem possible to get the desired result, but we’ll see…
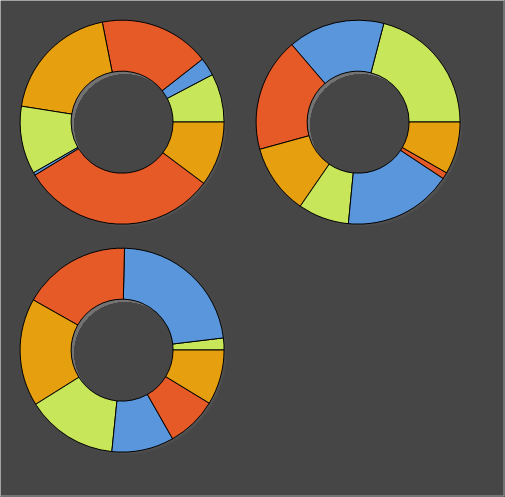
The first thing to do is set the Chart to 2D, hide the Title and the Legend, we’ll also hide the Marks for each of the series. Here we have :
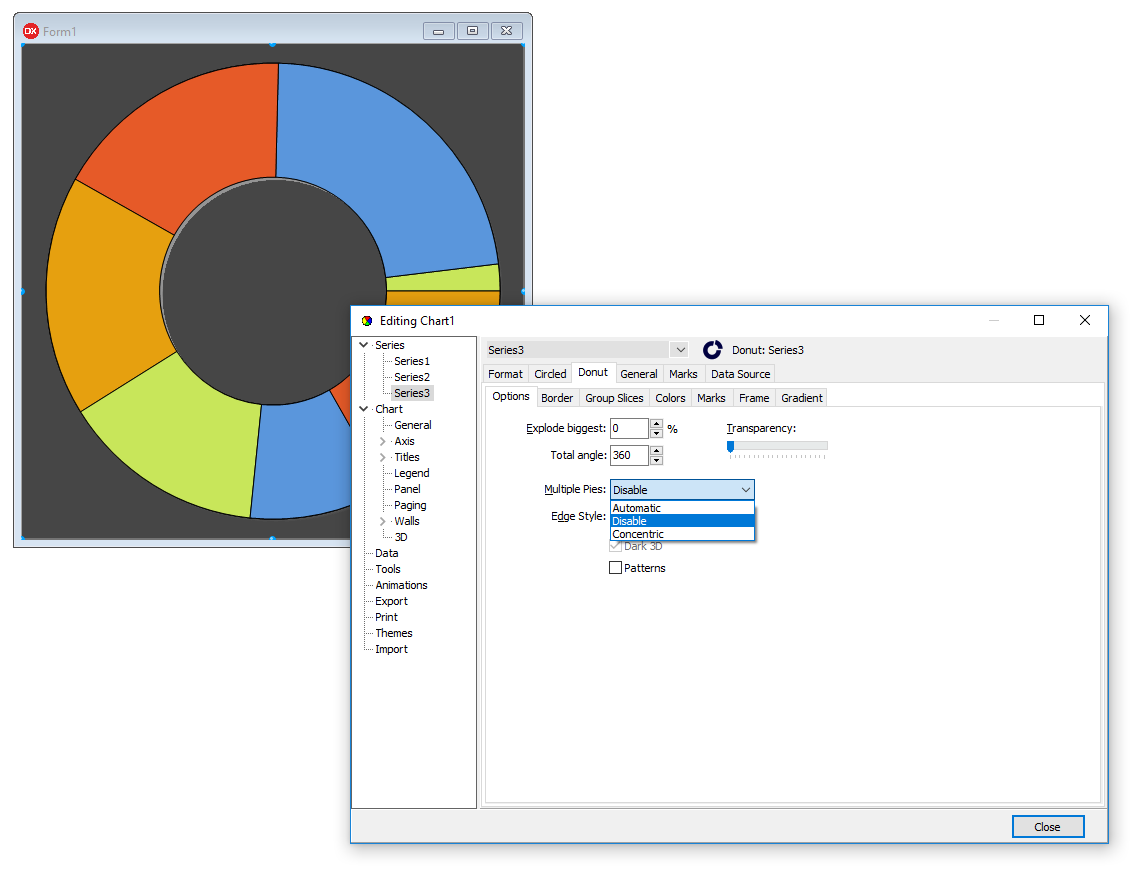
Now, it’s time to modify one of the important properties that will start to make changes. It’s the property named “Multiple Pies”, within the Editor -> Series -> Series1 -> Donut -> Options -> Multiple Pies. By default this is set to “Automatic”, we’ll change it to “Disable” for all of the Series.
Once this property is modified, it will look like we only have one Donut series in the Chart, as shown here.
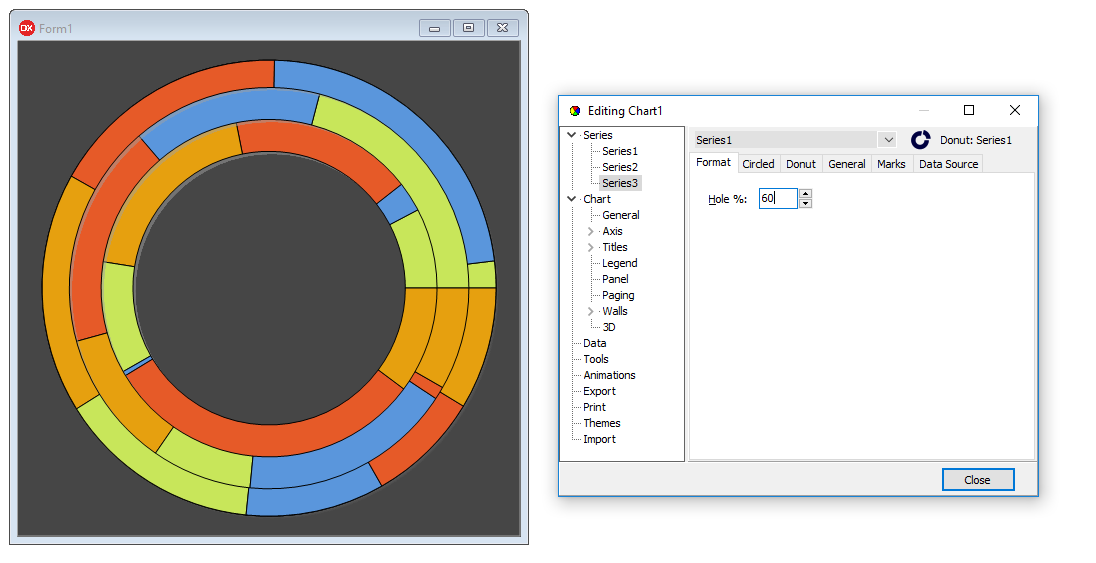
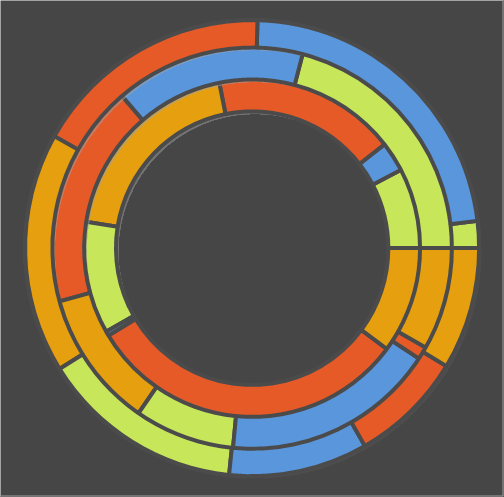
It is time to change another important property that will modify the Chart, it is the property named “Hole%”, we find it within the options of each series, in the “Format” tab. Here we’ve to set different percentage values for each of the Donut series’ holes, distributing the size between the different Series. The first Series must contain smaller hole size, we can set a value of “60%”, in the second Series (in the case we’ve three series) we’ll set a value of “74%” and “88%” for the third. The result will be:
Now, all you have to do is hide the Pen for each Series, or set a different color and size, and we’ll have the look of the Chart that we wanted.
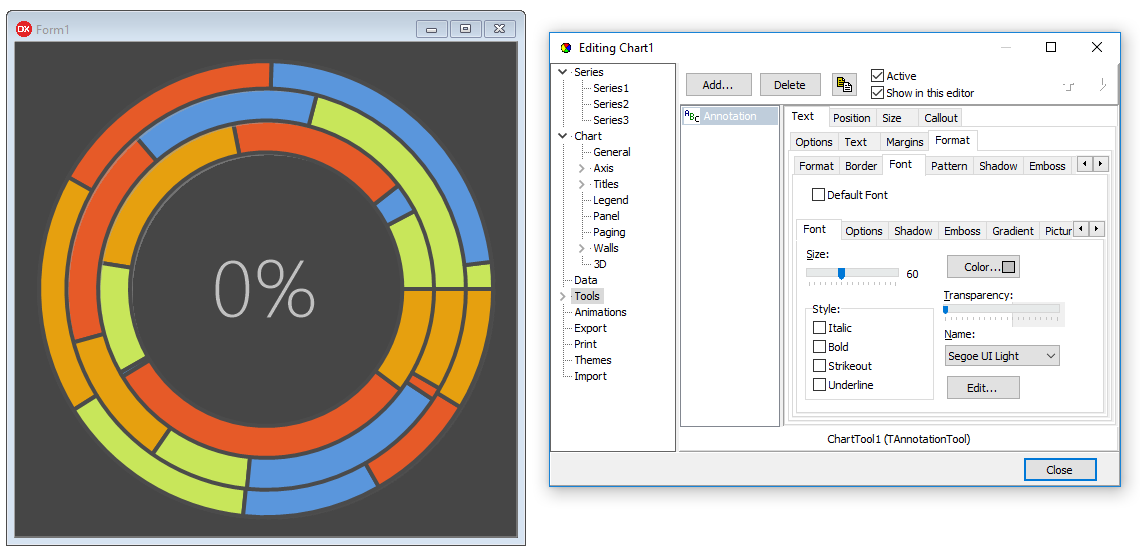
As an extra characteristic of the Series or Chart, I’m going to add a Text, just in the centre, that will show the activities value. To do this, I can use an “Annotation Tool” already available in TeeChart, and also created/added via the TChart editor. Set annotation alignment to “center” and format the font.
An important feature of this Series type (Activity Gauge) it’s its animation. TeeChart Pro incorporates several Animations for the different Series types, but in this case, as we’re creating a type of series totally personalized, we will create the animation manually.
We’ve to add three TTimer objects to the form, one for each series, set them “Enabled” to False and define an “Interval” of 10.
We can also add a Button component, which is the one that we’ll use to start the animation.
Now let’s give it functionality; we’ll do the next steps through code.
The first thing we do via code, is create a method where we’ll reset and initialize all the Series values, named “ResetValues”, this will be the code:
procedure TActivityGaugeForm.ResetValues;
var i : integer;
begin
  ChartTool1.Text := '0 %';
  Chart1.Hover.Visible := false;

  for i := 0 to Chart1.SeriesCount-1 do
  begin
    Chart1[i].FillSampleValues(2);
    Chart1[i].YValue[0] := 100;
    Chart1[i].YValue[1] := 0;
    Chart1[i].ValueColor[0] := Series1.Pen.Color;
  end;
end;
We’ll call this method from the CreateForm event of Application, and also every time Button1 is clicked :
procedure TActivityGaugeForm.FormCreate(Sender: TObject);
begin
  ResetValues;
end;

procedure TActivityGaugeForm.Button1Click(Sender: TObject);
begin
  ResetValues;
  Timer1.Enabled := true;
  Button1.Enabled := false;
end;
Now, the only missing thing is to add the code that generates the Series animation inside its corresponding Timer event :
procedure TActivityGaugeForm.Timer1Timer(Sender: TObject);
begin
  Series1.YValue[0] := Series1.YValue[0]-1;
  Series1.YValue[1] := Series1.YValue[1]+1;

  ChartTool1.Text := round(Series1.YValue[1]).ToString() + ' %';

  if (Series1.YValue[1] = 90) then
  begin
    Timer1.Enabled := false;
    Timer2.Enabled := true;
  end;
end;

procedure TActivityGaugeForm.Timer2Timer(Sender: TObject);
begin
  Series2.YValue[0] := Series2.YValue[0]-1;
  Series2.YValue[1] := Series2.YValue[1]+1;

  ChartTool1.Text := round(Series2.YValue[1]).ToString() + ' %';

  if (Series2.YValue[1] = 75) then
  begin
    Timer2.Enabled := false;
    Timer3.Enabled := true;
  end;
end;

procedure TActivityGaugeForm.Timer3Timer(Sender: TObject);
begin
  Series3.YValue[0] := Series3.YValue[0]-1;
  Series3.YValue[1] := Series3.YValue[1]+1;

  ChartTool1.Text := round(Series3.YValue[1]).ToString() + ' %';

  if (Series3.YValue[1] = 60) then
  begin
    Timer3.Enabled := false;
    Button1.Enabled := true;
  end;
end;
We have everything. Now it’s time to run the application and see the result. You should see something similar to:
Source code of the example available at the Steema Github.