The example uses TeeChart’s Circular and Numeric Gauges to simulate the acceleration of a 2016 Subaru BRZ car.
Example code for this demo may be downloaded from the github repository:
Demo code at github.com/Steema
This is a simulation only and though the basis is fairly faithful to empirical results it does not make claims to authenticity.
To compile this demo you need the TeeChart assembly, teechart.dll. The evaluation version can be downloaded via the evaluation version page:
https://www.steema.com/downloads/net
Project notes
Some factors that the demo takes into account:
– Redline (change gear when reaching the redline)
– Powerband; keep the engine in the powerband after the changeup
– True top speed. The demo is close to reported performance data
For this demo not all the of gaugeable data has been put into TeeChart Gauge format, the fuel gauge and oil temperature gauge have been left alone, but they could also be automated.
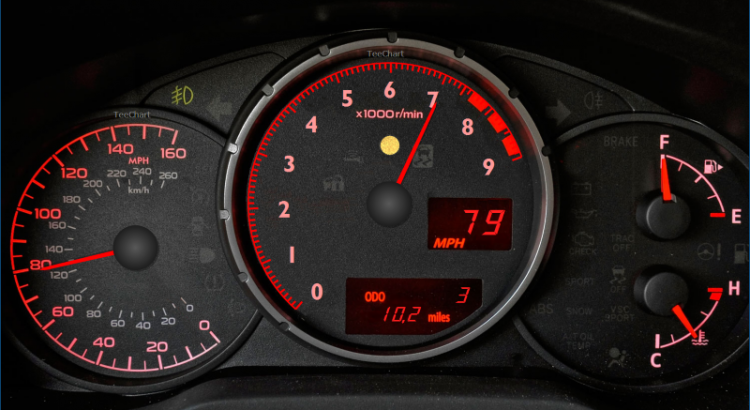
The demo uses an image of a dashboard and superimposes TeeChart’s circular gauges on it. One of the dials has been remade from scratch and the other uses the existing scale.
Setting up the demo
This has been built as a winform demo.
An image of the dashboard is selected and modified to make the backdrop image of our working Form. The image has been prepared, removing the scale from the tachometer and the removing the dial needles from both the tachometer and speedometer.
Adding the Charts
The Tachometer is formed by one TeeChart and has been modified to use three TeeChart Series, a CircularGauge for the tachometer itself, one Numeric Gauge for the speed and another NumericGauge for the odometer and gear indicator.
The Speedometer is formed by a TeeChart CircularGauge.
Customising the TeeChart Gauges
Tachometer
The tacho scale has been completely rebuilt by the TeeChart Editor and some runtime code modifications. It reflects the original scale minus the redline zone, that, whilst it could be defined by TeeChart itself, remains part of the background image.
Gearchange indicator, digital-readout speed and distance covered are all included in two NumericGauges in the TeeChart “RevChart”.
Speedometer
The speedometer is limited to using a CircularGauge needle. The Gauge’s scale remains that of the underlying image.
Demo code
Data arrays
The demo is controlled by three arrays:
speedRevChgUp = new double[] { 39, 57, 86, 110, 133, 143 };
secsToChange = new int[] { 3, 3, 4, 6, 6, 10, 20 };
//gearchanges made at approx 7500rpm
speedRevDropStart = new double[] { 800, 4700, 5400, 5700, 6100, 5600 };
The rev limit for which to change gear has been defined at 7500rpm. The secsToChange array defines the time through each gear and the speedRevDropStart array, the revs to drop down to after a gear change. The speedRevChgUp array sets the top speed in each gear.
Timer
The demo form contains a Timer that is activated to run the simulation.
Control of the gears, speed, revs, distance and over-rev warning light are all controlled when the timer triggers.
If the control of the gears, speed, revs, distance and over-rev warning light are all controlled when the timer triggers then it is a really appreciative thing. Congrats!
Thanks. Yes, from the timer; there’s an animated image version of the ouput here:
https://www.steema.com/uploads/gallery/TeeChartSubaruBRZ.gif
Rebuilding the the tacho scale was a creative stuff that you guys did. It will help in simulating the acceleration to a great extent.