This guide explains how to add a TeeChart ActiveX control to an MS Access form and to populate it with data from a table.
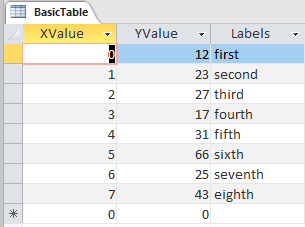
Our sample data table looks like this:
We create a new form in the forms section of the Access space and set it to design. We then open the ActiveX Control selector from the form-design palette:
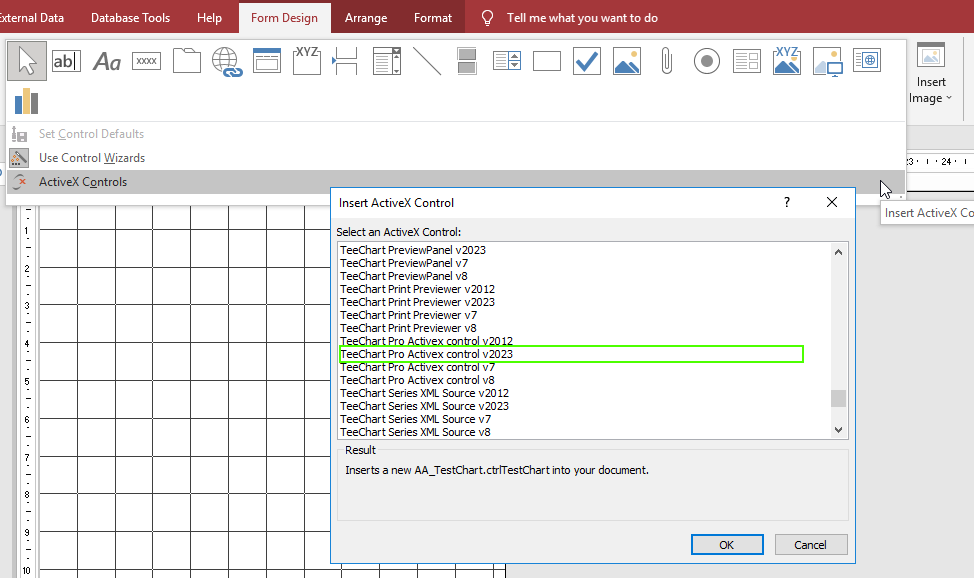
In this example there are many TeeChart controls to choose from. We’ll select the v2023 control and for this example we’ll also select the TeeCommander Bar.
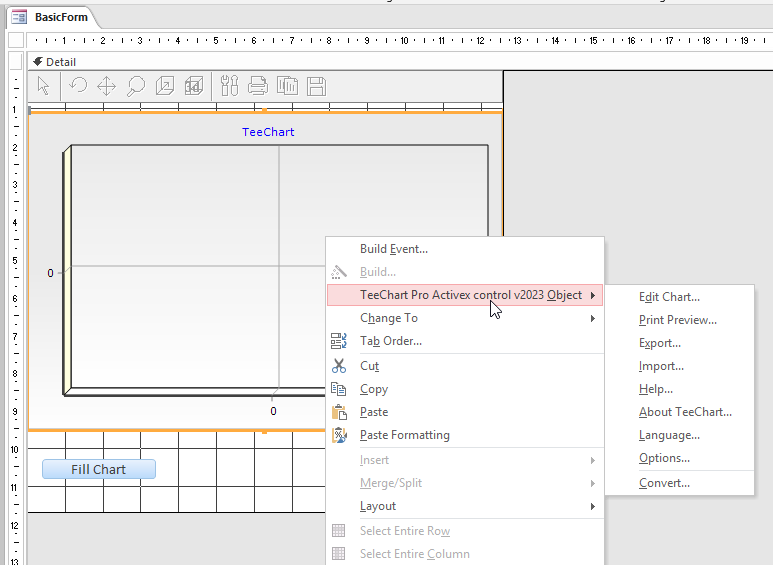
Add the Chart and Commander to the Form and add and caption a button for the form. We’ll load the data from the Basic Table to the chart in the button. It’s not necessary to use the button, the data could be loaded in the form load, but here we’ll prompt it from the button.
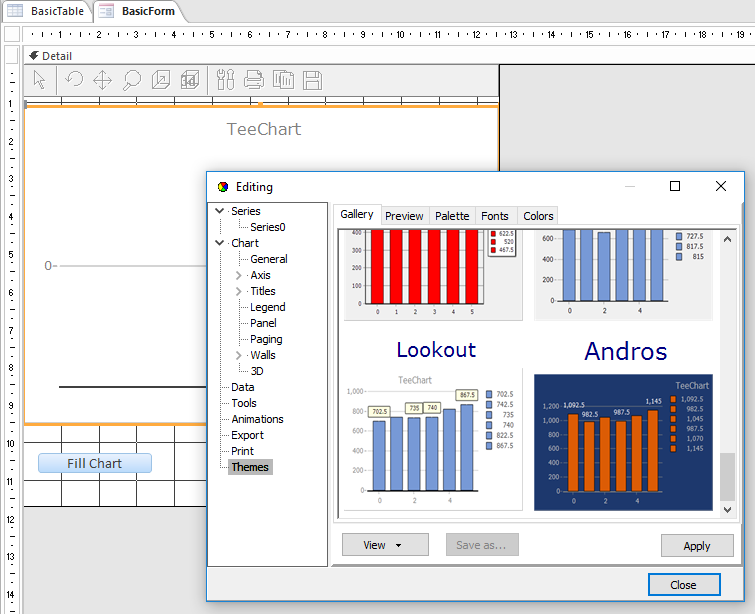
Chart Editor
We right mouseclick on the Chart to open the Chart Editor to add a Series and to select a Chart Theme from the Themes selector.
Add code
Right mouseclick on the button on the form and select “Build event”. That takes us to the VBA code editor and creates a button-click method. Here we add the Chart fill code:

The code we’ve added for the button is this:
Private Sub Command2_Click()
  TChart1.Series(0).Clear
  strsql = "Select * From BasicTable"
  Set rs = CurrentDb.OpenRecordset(strsql)
  If Not (rs.EOF And rs.BOF) Then
    rs.MoveFirst 'Unnecessary in this case, but still a good habit
    Do Until rs.EOF = True
       'vars are xvalue,yvalue,label and colour.
       'Auto colour is clTeeColor = 536870912 as referenced here:
       'https://github.com/Steema/TeeChart-ActiveX-
       'Samples/blob/master/Visual%20C%2B%2B/TeeChartDefines.h
       TChart1.Series(0).AddXY rs!XValue, rs!YValue, "", 536870912
       rs.MoveNext
    Loop
  Else
    MsgBox "There are no records in the recordset."
  End If
  rs.Close
  Set rs = Nothing
End Sub
You’ll notice we’ve also added a codeline in Form load to connect the TeeCommander bar to the Chart. ie:
Private Sub Form_Load(
TeeCommander0.ChartLink = TChart1.ChartLink
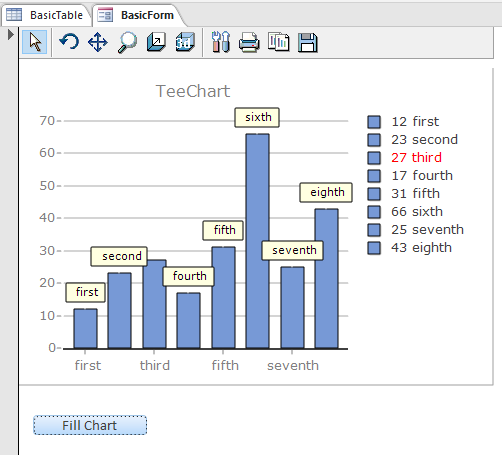
End SubThe resulting chart on the form looks like this:
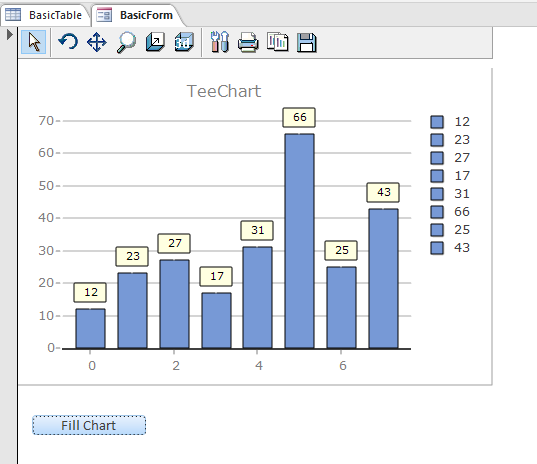
Note the parameters for the AddXY method. We haven’t added labels and have let the Chart decide the colour according to the palette selected with the Theme. If we choose to add the record’s labels, modifying the codeline like this:
TChart1.Series(0).AddXY rs!XValue, rs!YValue, rs!Labels, 5368709Then the chart would appear like this: