Introduced in October 2019 in TeeChart for RAD Studio, the Kernel Density Estimation Function provides the basis for two series types:
- Violin Series
- BeeSwarm Series
The Kernel Density Estimation (KDE) Function
The Kernel Density Estimation (KDE) Function uses these parts:
- Input Values
- Position (the x offset)
- Resolution
- Bandwidth
If left to automatically clamp the data, the KDE function checks highs and lows from the input data to set min and max limits. The values can be manually overridden.
A full definition of KDE here:
https://en.wikipedia.org/wiki/Kernel_density_estimation
In simpler terms, with respect to usability in TeeChart; the KDE uses the Resolution value to set the output Y value range and scans the input data for the mean of the input kernel values with respect output Y. Increasing the KDE Bandwidth value reduces sensitivity and ‘smooths’.
The Violin Series
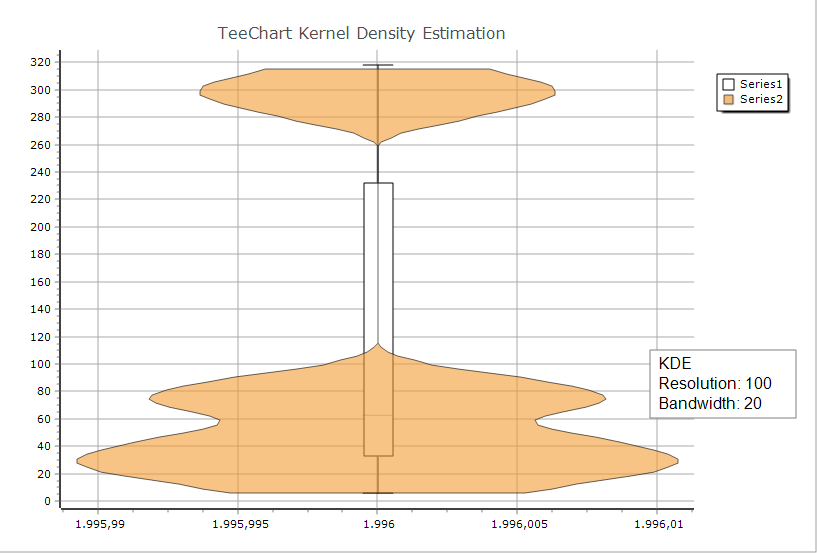
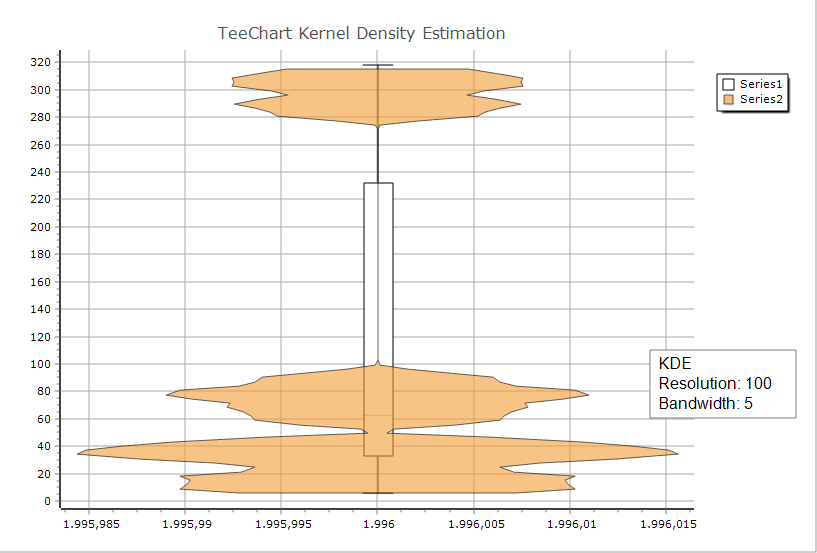
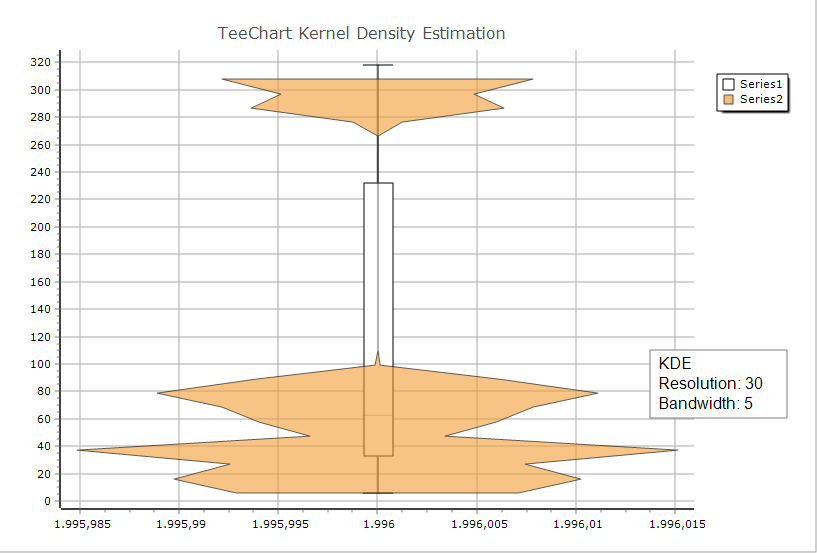
The Violin Series is a loyal representation of KDE as a series of polygonesque shapes, where each shape emerges with displacements of greater than 0 from the KDE position.
Often shown with the given Box plot for the corresponding data, here are three examples of the Violin series, that uses KDE, show the same data with low and higher bandwidth and resolution settings:
The BeeSwarm Series
The BeeSwarm Series has a few underlying differences to the Violin Series apart from the general appearance. Its plot consists of points and it uses the point size to define the resolution that limits the number of point rows across the vertical range; the points that fit according to point size without overlapping. BeeSwarm checks value cluster-densities with respect to Point row Y locations and brings the values into the rows, ‘swarming’ them.
The following two charts show the difference that varying the point size makes on the number of BeeSwarm rows.
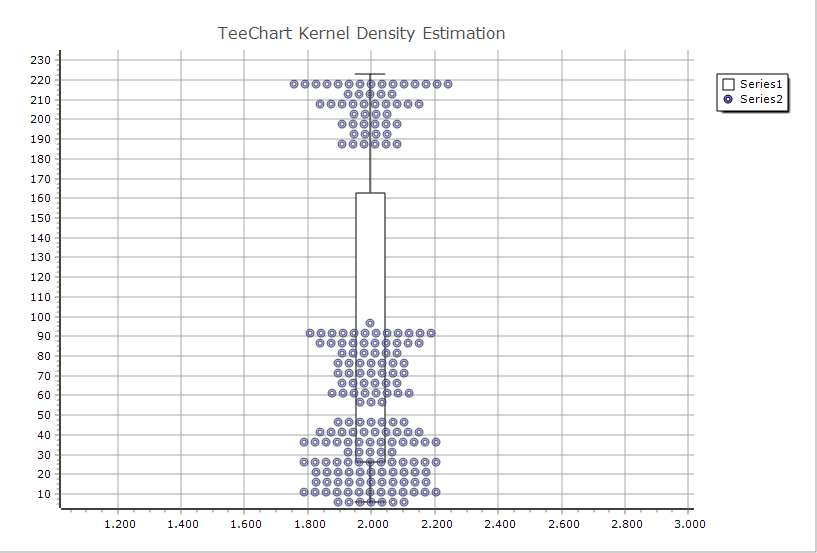
4×4 pixel points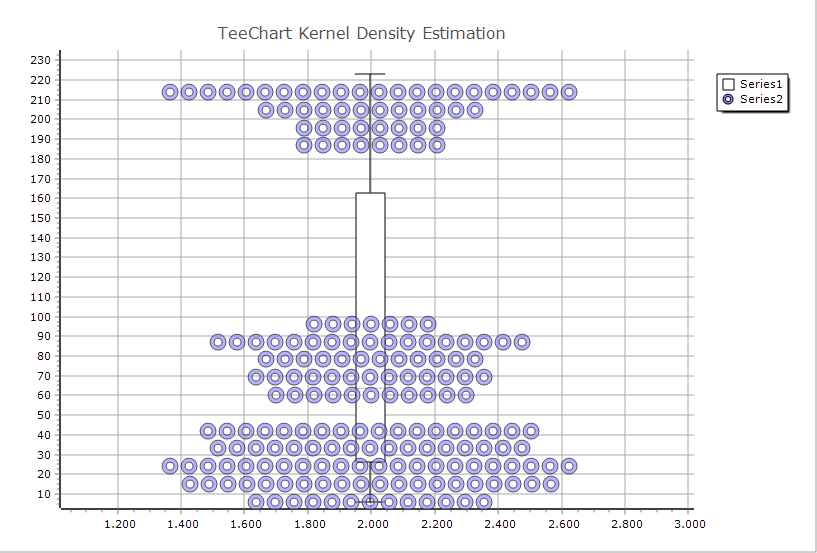
8×8 pixel points
Setting up the Violin and BeeSwarm plots
You can use the TeeChart Editor but here’s a code example. The key is simply to load data to the Violin’s input. That could take the form of Datasource, where the datasource is, for example, a Series with a Y-valuelist.
Create the Series
uses TeeBoxPlot;violin := TViolinSeries.Create(self);
Chart1.AddSeries(violin);Add data to the source Series. If the source is a Boxplot Series then you’ll be settingthe Position. The Violin and BeeSwarm use the Position:
MyBoxPlotSeries.Position := 2019;Set up the Datasource for the Violin and refresh data.
violin.DataSource := MyBoxPlotSeries;
violin.CheckDataSource;
Optionally you can pass a valuelist directly to the Violin Series.
eg.
violin.Update(MyBoxPlotSeries.YValues);The techniques are identical for BeeSwarm.
Can the beeswarm plot be easily modified to have a column scatterplot (with random jitter along the x-axis but with the orginal y-values unaffected) or is there a way to easily do this using the standard scatterplot in TeeChart?
Hello,
Re. ” is there a way to easily do this using the standard scatterplot in TeeChart”
Yes, we’d need to see an example to be sure we can reproduce the requirement, but it should be ‘do-able’
Hi,
I mean something like the left graph on Prism’s website (please scroll-down to the bottom of the page):
https://www.graphpad.com/guides/prism/8/user-guide/using_graphing_each_replicate.htm?q=column+scatterplot
It doesn’t actually seem randomly jittered but it seems as if the data are spread along the x-axis according to their density (similar to the BeeSwarm) but not exactly like this. The BeeSwarm basically looks like a histogram but the aforementioned plot is different. The y-values are not actually binned.
Any ideay?
Hi, for some reason I didn’t see this last question. Sorry. Late now to answer but I’ve looked at the charts that have been linked. That’s not possible now under current design but we’ll add it as a feature request.