The TeeChart for .NET Core components may be used in a Razor component to add reusable code to your project portfolio.
This post reviews two approaches, the use of a static TeeChart image rendered to the page and the use of a live Javascripted TeeChart.
Example project here:
https://github.com/Steema/TeeChart-for-.NET-CSharp-Web-samples/tree/master/TeeChartWithBlazor
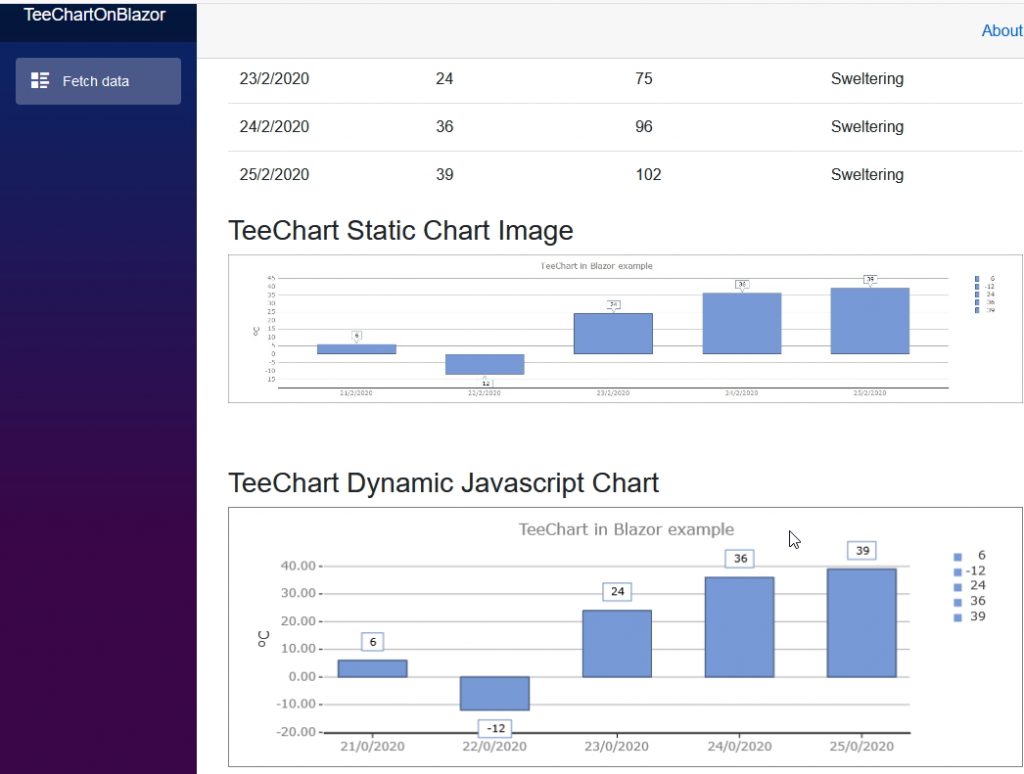
Image shows project output
Setting up
We chose to create a standard Blazor project.
In Visual Studio, Create a new Project and select “Blazor App” as project type. We called ours “TeeChartOnBlazor”.
If you run this new project you’ll see it already comes loaded with content, a homepage, a counter and a fetch data page that shows some randomly generated weather stats.
Add a dependency to TeeChart for the project. The project is Net.Core 3 so if you go to the Nuget Manager you can select and add the “Steema.TeeChart.NETCore” assembly.
Via the file add menu, add a new Razor Component to the Pages folder; call it “ChartGen.razor”.
Adding code
Now that you have the building blocks in place you can start to add the chart generation code to the new ChartGen.razor component file.
Connect to data and render Chart as image
We’ll add the code to create the TeeChart and connect to the data. The data comes in dynamically from the page that is rendering the data table; that way we can be sure that the data is synchronised per call.
Add a few usings to the ChartGen.razor page before the “ChartGen” header.
ChartGen.razor
@using Steema.TeeChart;
@using System.IO;
@using System.Drawing;
@using TeeChartOnBlazor.Data;   //the project data
Underneath, add the code block for the new component. The code to populate the chart and render as an image consists of one method. The method accepts the data, populates the chart and renders it as an image that is converted to Base64 text, directly transportable to the img tag on the page.
@code {
  public Task<String> GetChart(WeatherForecast[] forecasts, int
                 width, int height) {
    Steema.TeeChart.Chart mChart = new Chart();
    Steema.TeeChart.Styles.Bar mBar = new Steema.TeeChart.Styles.Bar();

    mChart.Header.Text = "TeeChart in Blazor example";

    mChart.Series.Add(mBar);

    //mBar.FillSampleValues();
    foreach (WeatherForecast forecast in forecasts) {
      int aDate = (int)Math.Truncate(forecast.Date.ToOADate()); //day stamp
      mBar.Add(aDate, forecast.TemperatureC);
    }

    mBar.Origin = 0;

    mBar.XValues.DateTime = true;
    //mChart.Axes.Bottom.Labels.Angle = 90;
    mChart.Axes.Bottom.Increment = Steema.TeeChart.Utils.GetDateTimeStep(DateTimeSteps.OneDay);

    MemoryStream ms = new MemoryStream();
    mChart.Export.Image.JPEG.Width = width;
    mChart.Export.Image.JPEG.Height = height;
    mChart.Export.Image.JPEG.Save(ms);
    Image img = Image.FromStream(ms);

    String str = Convert.ToBase64String(ms.ToArray());

    return Task.FromResult("data:image/bmp;base64," + str);
  }
}
FetchData.razor
In the FetchData.razor component file, we’ll add a call to the chart and place an html tag inline with the page html to render it.
In the code section, populate the chart. Set a variable and call the chart method:
WeatherForecast[] forecasts;
String chartImage;

protected override async Task OnInitializedAsync()
{
  forecasts = await ForecastService.GetForecastAsync(DateTime.Now);

  ChartGen cGen = new ChartGen();
  chartImage = await cGen.GetChart(forecasts, 1200, 300);
}
In the html section of the component file, underneath the close table tag for the displayed data, add these lines:
<h3>TeeChart Static Chart Image</h3>
<p><img src="@chartImage" width="100%" /></p>
The html reference the chartImage variable and displays the Chart. That’s it! With a single method and no extra dependencies beyond adding TeeChart itself, you have rendered the contents of a data table to a Chart.
Connect to data and render Chart as a native Javascript TeeChart
To plot charts as dynamic TeeChart javascript objects takes a few more steps but is not especially complicated. Once setup a javascript chart can be enhanced to provide full interactivity and response to data circumstances.
Let’s start by adding the code method to ChartGen.razor, just underneath the method we setup for the Image version.
ChartGen.razor
The method is very similar to the chart Image format code. There are a couple of extras added in to facilitate chart resize once in the browser.
public Task GetJSChart(WeatherForecast[] forecasts, int width, int height)
{
  Steema.TeeChart.Chart mChart = new Chart();
  Steema.TeeChart.Styles.Bar mBar = new Steema.TeeChart.Styles.Bar();

  mChart.Header.Text = "TeeChart in Blazor example";
  mChart.Series.Add(mBar);

  //mBar.FillSampleValues();
  foreach (WeatherForecast forecast in forecasts)
  {
    int aDate = (int)Math.Truncate(forecast.Date.ToOADate()); //day stamp
    mBar.Add(aDate, forecast.TemperatureC);
  }

  mBar.XValues.DateTime = true;
  //mChart.Axes.Bottom.Labels.Angle = 90;
  mChart.Axes.Bottom.Increment = Steema.TeeChart.Utils.GetDateTimeStep(DateTimeSteps.OneDay);

  chartName = "dynoTeeChart";
  mChart.Export.Image.JScript.ChartName = chartName;

  MemoryStream ms = new MemoryStream();
  mChart.Export.Image.JScript.Width = width;
  mChart.Export.Image.JScript.Height = height;
  mChart.Export.Image.JScript.DoFullPage = false; //inline, no page  header tags
  mChart.Export.Image.JScript.CustomCode = new string[] { "resize("+chartName+");" };
  mChart.Export.Image.JScript.Save(ms);

  ms.Position = 0;

  StreamReader reader = new StreamReader(ms);
  //setup our chart name, here 'dynoChartName'.
  string result = "<script>var "+chartName+"; " + reader.ReadToEnd() + "</script>";

  return Task.FromResult(result);
}
FetchData.razor
As we did for the image version of the chart, we add a string variable to the component, call the method that populates it and add an html tage to the page to render it. In this case the tag is an HTML5 Canvas tag.
<h3>TeeChart Static Chart Image</h3>
<p><img src="@chartImage" width="100%" /></p>
<br />
<br />
<h3>TeeChart Dynamic Javascript Chart</h3>
<canvas id="canvas1" width="1400" height="300" style="border: 1px solid #808080;">
  This browser does not seem to support HTML5 Canvas.
</canvas>

@((MarkupString)chartJS)@((MarkupString)(chartResize));
Note the tag at the end, @((MarkupString)chartJS), that’s the javascript chart variable, a populated string when run, with an instruction to leave the string in its native form and not try to convert it to human-readable form. The second MarkupString variable adds the Chart resize code, more on that a little further down this section.
The code section of the page now looks like this:
@code {
  WeatherForecast[] forecasts;
  String chartImage;
  String chartJS;
  String chartResize;

  protected override async Task OnInitializedAsync()
  {
    forecasts = await ForecastService.GetForecastAsync(DateTime.Now);

    ChartGen cGen = new ChartGen();
    chartImage = await cGen.GetChart(forecasts, 1200, 300);
    chartJS = await cGen.GetJSChart(forecasts, 1200, 300);
    chartResize = "<script> function resizeChart() { resize("+cGen.chartName+"); } </script>";
  }
}
We’ll now be rendering the Chart twice to the page, as an image and as a javascript-chart.
We’re finished with the ChartGen.razor and FetchData.razor files now. Although we’ll need some links to TeeChart’s javascript source files we can’t put script links into the Razor components so they’ll need to go into the _Host.cshtml file that accompanies the project.
_Host.cshtml file
These lines should go into the page header:
  <script src="https://www.steema.com/files/public/teechart/html5/latest/src/teechart.js" type="text/javascript"></script>
  <script src="https://www.steema.com/files/public/teechart/html5/latest/src/teechart-extras.js" type="text/javascript"></script>
  <script src="https://www.steema.com/files/public/teechart/html5/latest/src/date.format.js" type="text/javascript"></script>
  <script src="https://www.steema.com/files/public/teechart/html5/latest/src/teechart-maps.js" type="text/javascript"></script>
  <script src="js/utils.js" type="text/javascript"></script>
Resize code
Note the last line of the script references, a link to the ‘js/utils.js’ file. We don’t have that in the project yet. We’ll add a new folder called “js” under the “wwwroot” folder and add a new javascript file called ‘utils.js’.
The script call to it, manage the resizing of the javascript chart in a re-dimensioned browser window.
utils.js file
The script manages resizing for the chart when the browser page itself is resized. Here’s the contents:
function resize(chart) {

  var startWidth = 1600;
  var startHeight = 400;
  var w;
  var h;
  var canvas = chart.canvas;
  if (chart != null) {
    if (/Android|webOS|iPhone|iPad|iPod|BlackBerry|IEMobile|Opera Mini/i.test(navigator.userAgent)) {

      w = window.innerWidth;
      h = window.innerHeight;
      if (w <= 991) {
        canvas.style.width = "" + w * 0.9 + "px";
        canvas.style.height = "" + w * 0.9 * startHeight / startWidth + "px";
      }
      else {
        canvas.style.width = "" + startWidth + "px";
        canvas.style.height = "" + startHeight + "px";
        chart.bounds.width = startWidth;
        chart.bounds.height = startHeight;
      }
      chart.draw();
    }
    else {
      w = startWidth;
      h = startHeight;
      if ((window.innerWidth - canvas.offsetLeft - 20) < startWidth)
        w = window.innerWidth - canvas.offsetLeft - 20;
      else
        w = startWidth;
      if ((window.innerWidth * startHeight / startWidth) < startHeight)
        h = window.innerWidth * startHeight / startWidth;
      else
        h = startHeight;

      canvas.setAttribute('width', "" + w + "px");
      canvas.setAttribute('height', "" + h + "px");
      canvas.style.width = "" + w + "px";
      canvas.style.height = "" + h + "px";
      chart.bounds.width = w;
      chart.bounds.height = h;
      chart.draw();
    }
  }
}
Resize is called by adding a call to it in the body onresize event of _Host.cshtml file
<body onresize="resizeChart()">The method has been created in the ChartGen GetJSChart method and loaded via the FetchData.razor component file.