This demo shows how TeeChart’s Charts can be made to work with each other on a Form in a Winform application.
The demo uses the basis of the company data of a small technical products supplier; the company sells electronic based products, small computers, tablets and mobile phones and has markets in some countries around the globe.
Demo code project, written with Visual Studio 2015, can be downloaded here: https://www.steema.com/files/public/teechart/net/LinkingCharts_TChartNET.zip. Version on Github here: https://github.com/Steema/TeeChart-for-.NET-CSharp-WinForms-samples/tree/master/LinkingCharts
Create the project
We create a new Winforms project, and rename the main form to ReportForm.
1. Add objects to Form. We add three charts, a dataGridView and a textbox to the form and position them to take up the full space of the form (see fig. 1).

Fig.1 Designtime in Visual Studio
2. Using the Chart Editor, we have added a dataseries to the charts plus a smoothing function that you can see populated with random data at this stage. Data series can be added at designtime or at runtime.
3. We’ve placed the company sales data in an MS Access file called TechProducts Ltd and placed the file in the LinkingCharts solution folder.
Add the data to the project
4. We’ve added the database to the project, publicising tables and queries (views).
5. Using BindingSource components we connect to the Access database. The database already has prepared queries for some of the data we wish to visualise. For other cases, during runtime execution, we will write some sql queries in the code.
Three BindingSources are added, connecting to the $_€_SalesByYear, $_SalesByCountry_2015 and $_SalesByContinent views.
Connect the Charts to the data
6. To connect to a bindingSource, open up the Chart Editor that you wish to modify and select the Series that has previously been added and go to its Datasource tab. If you click on the Dataset tab you can select the bindingSource to which to connect that Series. In the following selection boxes, you can relate the different source fields to the X and Y series valuelists. See Fig. 2.
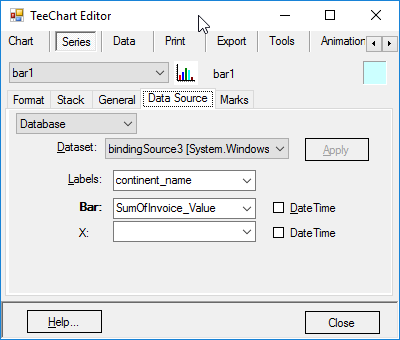
Fig.2 Series datasource editor
7. Repeat the connection technique for the three charts. We have connected the left Bar Series Chart to the SalesByContinent data, the right, Pie chart, to the SalesByCountry_2015 data and the lower line chart to the SaleByYear data.
Linking the Charts
8. We now have three charts, data by continent, region (countries with sales, within a continent) and country. Our aim in this demo is to link the three chart so that, by actioning a click on a bar of the continent chart, we can fill the region chart and that by actioning a click on the region chart we can show the sales evolution, over the last few years, of the selected country. The dataGridView will update to show the contents of the region chart. Note that the demo will open showing all countries in the region chart. The textbox updates to show ‘simulation’ commentary by a “robot journalist”.
9. To link the different elements of the project page we’ll set up some chart events.
ClickSeries event
We are using the ClickSeries event to take the value from the clicked chart as argument in a query to populate the next, related chart.
We can add the event definition at designtime by selecting the chart from which we wish to action and selecting the events tab of Visual Studio’s Properties window and, in this case, selecting the click event from the list for the TChart. That creates the event method in the Form’s code page. Here we’ll need to add some content so relate the Series click with where we wish to go.
We have chosen to partially manually code the query for clarity. The method follows these steps:
Take the original query for the country/continent chart as the basis, modify it to collect data for all available years.
Modify region query:
@contiparam is the continent that you wish to view, sourced from the label of the Continents Chart value. One could use the index value or some other variable if that were to make a better index for the query.
string sqlStr = "SELECT Sum(Fact_Invoices.Invoice_Value) AS SumOfInvoice_Value, Lookup_Country.Country_name, Lookup_Continent.continent_name";
 sqlStr += " FROM((Fact_Invoices INNER JOIN Lookup_Customers ON Fact_Invoices.Cod_Customer = Lookup_Customers.Cod_Customer)";
 sqlStr += " INNER JOIN Lookup_Country ON Lookup_Customers.Country_code_A2 = Lookup_Country.Country_code_A2)";
 sqlStr += " INNER JOIN Lookup_Continent ON Lookup_Country.Continent = Lookup_Continent.continent";
 sqlStr += " where Lookup_Continent.continent_name = @contiParam GROUP BY Lookup_Country.Country_name, Lookup_Continent.continent_name";
DataSet customers = new DataSet();System.Data.OleDb.OleDbDataAdapter myAdapter = new System.Data.OleDb.OleDbDataAdapter(sqlStr, this.___SalesByCountry_2015TableAdapter.Connection);Modify country query:
We take the label of the country that we wish to review, as the argument for the country-over-time query.
string sqlStr = "SELECT Sum(Fact_Invoices.Invoice_Value)AS SumOfInvoice_Value, Fact_Invoices.Invoice_year AS AYear, Lookup_Country.Country_name";
sqlStr += " FROM(Lookup_Customers INNER JOIN Fact_Invoices ON Lookup_Customers.Cod_Customer = Fact_Invoices.Cod_Customer)";
sqlStr += " INNER JOIN Lookup_Country ON Lookup_Customers.Country_code_A2 = Lookup_Country.Country_code_A2";
sqlStr += " WHERE Lookup_Country.Country_name = @countryParam";
sqlStr += " GROUP BY Fact_Invoices.Invoice_year, Lookup_Country.Country_name";
Those queries are enough to link the charts. We have taken a click in the same way from the GridView. Taking just one of them as an example, for the region chart, you can see how a bindingSource is created for the recipient chart to ‘plug-into’.
Creating and using a new bindingSource with the sql query as source for Grid and Chart.
DataSet customers = new DataSet();

System.Data.OleDb.OleDbDataAdapter myAdapter = new System.Data.OleDb.OleDbDataAdapter(sqlStr, this.___SalesByCountry_2015TableAdapter.Connection);

//apply region code
myAdapter.SelectCommand.Parameters.Clear();
myAdapter.SelectCommand.Parameters.Insert(0, new System.Data.OleDb.OleDbParameter("contiParam", region));
myAdapter.Fill(customers, "Customers");

bindEurope = new BindingSource();
bindEurope.DataSource = customers;
bindEurope.DataMember = customers.Tables[0].ToString();

dataGridView1.DataSource = bindEurope;
dataGridView1.Refresh();

dataGridView1.Columns[0].HeaderText = "Sales Income";
dataGridView1.Columns[1].HeaderText = "Country";
dataGridView1.Columns[2].HeaderText = "Continent";

tChart3[0].DataSource = bindEurope;
tChart3[0].YValues.DataMember = "SumOfInvoice_Value";
tChart3[0].LabelMember = "Country_name";

tChart3[0].CheckDataSource();
The Chart Series’ CheckDatasource() method is used by TeeChart to refresh the Chart data.
Application output
The screenshots in Fig 3 & 4 show the application at runtime.

Fig. 3. Application startup

Fig. 4. Europe & Switzerland selected.