Use TeeChart’s export to HTML5 and/or Javascript options to create native static or live browser charts on the HTML5 Canvas.
You may have developed a desktop application and require that a reporting chart be published to a webpage. This article reviews TeeChart’s options to create Javascript for the browser page.
Sourcecode for this article:
https://github.com/Steema/TeeChart-VCL-samples/tree/master/JScriptExport
Static HTML5 export
This option creates a Javascript low level rendering instruction sequence that reproduces a desktop based chart identically. To run an export first add a uses to your project:
uses VCLTee.TeeHTML5Canvas;Then add the following code to run the export:
procedure TForm1.Button2Click(Sender: TObject);
var exporter:  THTML5ExportFormat;
begin
  //HTML5 Canvas fixed graphic
  exporter:=THTML5ExportFormat.Create;
  TeeSaveToHTML5File(Chart1,AppDir + 'myoutput\1_HTML5_Canvas_Chart.htm', DesWidth, DesHeight);
  exporter.Width:=DesWidth;
  exporter.Height:=DesHeight;
  exporter.Panel:=Chart1;
  Memo1.Lines:=exporter.HTML5;
end;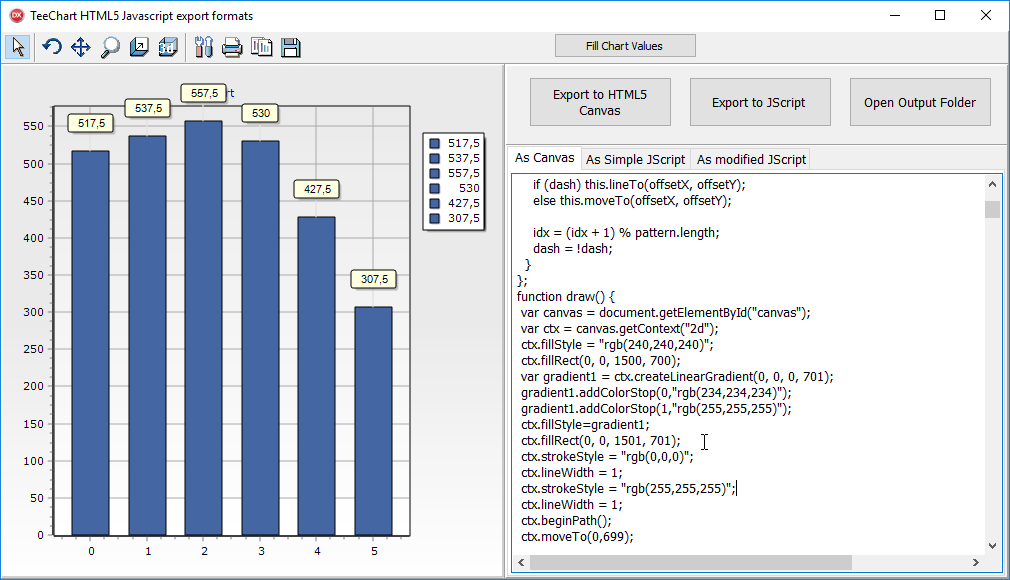
The export creates HTML page script and Javascript codelines that render line by line instructions to plot each Chart element on the HTML5 Canvas.
Example:
function draw() {
  var canvas = document.getElementById("canvas");
  var ctx = canvas.getContext("2d");
  ctx.fillStyle = "rgb(240,240,240)";
  ctx.fillRect(0, 0, 1500, 700);
  var gradient1 = ctx.createLinearGradient(0, 0, 0, 701);
  gradient1.addColorStop(0,"rgb(234,234,234)");
  gradient1.addColorStop(1,"rgb(255,255,255)");
  ctx.fillStyle=gradient1;
  ctx.fillRect(0, 0, 1501, 701);
  ctx.strokeStyle = "rgb(0,0,0)";
  ctx.lineWidth = 1;
  ctx.strokeStyle = "rgb(255,255,255)";
  ctx.lineWidth = 1;
  ctx.beginPath();
}
The chart created by this code behaves as a static image and although it would be possible to add further custom code to add notes to the image we recommend the following, alternative export method to achieve that.
Javascript export as live chart
This TeeChart export option isn’t supported for all Series types but where supported offers a completely dynamic and interactive chart on the browser page.
Supported Series types:
Line, Area, Bar, Pie, Points, Donut, Bubble, Candle, Gantt, ColorGrid, Surface 3D, Maps.
Differing from the TeeChart HTML5 export, JavaScript export uses TeeChart’s own JavaScript Library. The export creates the code lines necessary to use the library and to create a reproduction of the Delphi based chart. To run an export first add a uses to your project:
uses VCLTee.TeeJavascript;Place the following code into a button:
var exporter: TJavascriptExportFormat;
    CustCodeStr : TStringlist;
    srcLinks : TStrings;
begin
  //Javascript - "live" chart export.
  exporter:=TJavascriptExportFormat.Create;

  exporter.Width := DesiredWidth;
  exporter.Height := DesiredHeight;

  exporter.SaveToFile(Chart1,AppDir + 'myoutput\2_Chartfromcode.htm');
That creates output of the following type, You can choose to set up the export as a complete html page or as a part for a page with multiple elements.
<title>Chart1</title>
<script src="http://www.steema.com/files/public/teechart/html5/latest/src/teechart.js" type="text/javascript"></script>
<script type="text/javascript">
var Chart1;
function draw() {
  Chart1=new Tee.Chart("Canvas1");
  Chart1.panel.format.fill="#F0F0F0";
  Chart1.panel.format.round.x=0;
  Chart1.panel.format.round.y=0;
  Chart1.panel.format.stroke.fill="";
  Chart1.panel.format.stroke.cap="round";
  Chart1.panel.format.gradient.colors=["#EAEAEA","#EAEAEA","#FFFFFF"];
  Chart1.panel.format.gradient.stops=[0,0.5,1];
  Chart1.panel.format.gradient.direction="topbottom";
  Chart1.panel.format.gradient.visible=true;
  Chart1.panel.margins.left=3;
  Chart1.panel.margins.right=3;
Note the script reference to teechart.js. That is the TeeChart javascript library, available for your use, used to render the chart on the HTML5 Canvas. the chart on the page is zoomable, scrollable, can receive new data and can respond to events.
Customising the Chart
Here’s an example of how to add modifications to the Chart, to change the Chart theme, titles, fonts, or to add content on the Chart itself. Here we’re adding some custom lines to the parsed Javascript code before exportation, here using a Memo component to unite some additional reference lines with a call to a javascript function.
//add some modifications
CustCodeStr := TStringlist.Create;
CustCodeStr.Add(' addFeatures('+exporter.ChartName+');');
exporter.CustomCode := CustCodeStr;
Here we’re adding a reference to a javascript code unit, jutils.js, then saving to file.
//add some source links
With Memo3 do
Begin
  Lines := exporter.JScript;
  Lines.Insert(6,'<script src="jutils.js" type="text/javascript"></script>');
  Lines.Insert(6,'<script src="'+exporter.SourceScriptPath+'/teechart-animations.js"   type="text/javascript"></script>');
  Lines.Insert(6,'<script src="'+exporter.SourceScriptPath+'/teechart-extras.js" type="text/javascript"></script>');
  Lines.SaveToFile(AppDir + 'myoutput\3_Chart_JScript_mods.htm');
End;
The jutils’ addFeatures method includes the modifications we wish to make.
For example:
function addFeatures(aChart) {
  aChart.applyTheme("minimal");

  //turn off marks
  aChart.series.items[0].marks.visible = false;

  //animation
  animation=new Tee.SeriesAnimation();
  animation.duration=2000;
  animation.kind="each";
  fadeAnimation=new Tee.FadeAnimation();
  fadeAnimation.duration=500;
  fadeAnimation.fade.series=true;
  fadeAnimation.fade.marks=true;
  animation.mode = "linear";
  fadeAnimation.mode = "linear";
  animation.items.push(fadeAnimation);

  animation.animate(aChart);

  //tooltip
  tip=new Tee.ToolTip(aChart);
  tip.render="dom";
  tip.autoHide=true;
  tip.domStyle = "padding-left:8px; padding-right:8px; padding-top:0px; padding-bottom:4px; margin-left:5px; margin-top:0px; ";
  tip.domStyle = tip.domStyle + "background-color:#FCFCFC; border-radius:4px 4px; color:#FFF; ";
  tip.domStyle = tip.domStyle + "border-style:solid;border-color:#A3A3AF;border-width:1px; z-index:1000;";

  aChart.tools.add(tip);
  tip.onhide=function() { scaling=0; poindex=-1; }
  tip.ongettext=function( tool, text, series, index) {
    var s = '<font face="verdana" color="black" size="1"><strong>'+ series.title+'</strong></font>';
    s = s + '<br/><font face="verdana" color="darkblue" size="1">Series point: <strong>'+ index.toFixed(0)+'</strong></font>';
    s = s +'<br/><font face="verdana" color="red" size="1">Value: '+series.data.values[index].toFixed(2)+'</font>';
    return s;
  }
}
The output for the Chart adds a one-loadtime, animation and marktips. The result comes out like this:
https://www.steema.com/files/public/teechart/vclfmx/jscriptdemo/3_Chart_JScript_mods.htm
