TeeChart Pro includes World and Map series classes to visualize GIS (Geographical) data, with several ways to create or import “layers” made from ESRI(tm) SHP ShapeFiles, Google KML paths and simple Placemark text files.
See below the link to download the source code of an identical example for VCL and Firemonkey (FMX) frameworks, for Delphi 7 up to Embarcadero RAD Studio XE6 ides.
Download:
Source code example projects (VCL and Firemonkey) and ready-to-run executable demos.
Readme:
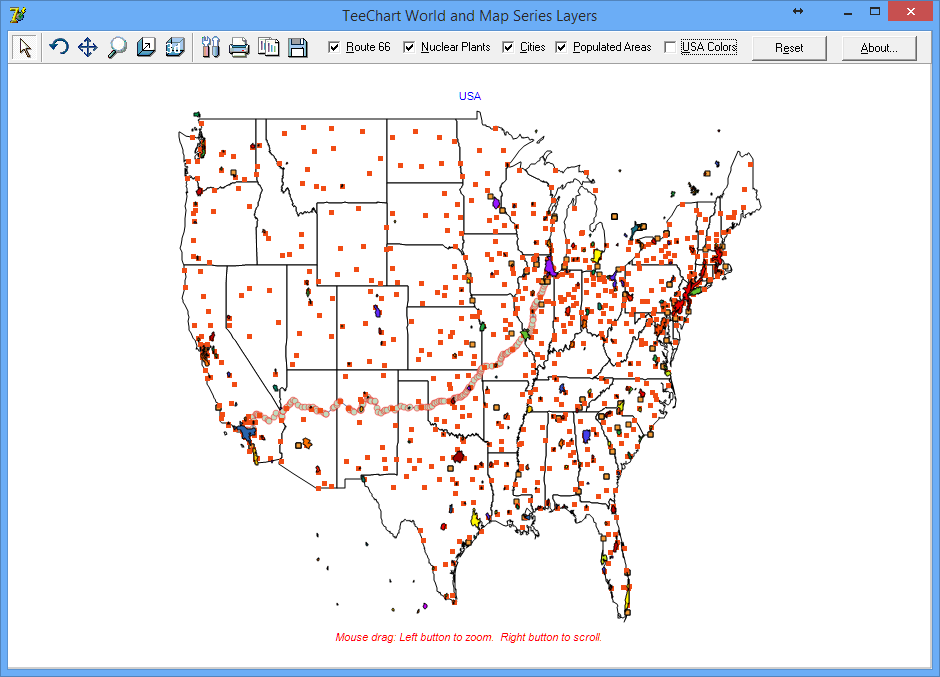
This example shows how to use different TeeChart Series as “layers” to visualize different kinds of data.
- TeeChart World and Map series (polygons, shapes)
- ESRI ™ ShapeFiles
- Simple *.txt files containing placemarks
As each “layer” is a normal Series, it can be shown or hidden individually, and fully customized as usually (visual formatting, series data, etc)
Copyright notices:
Dataset file: ne_50m_urban_areas.shp
“Made with Natural Earth. Free vector and raster map data @ naturalearthdata.com”
Route 66 KML path file download.
Nuclear Power Plants KML download.
One thought to “GIS Map layers example using TeeChart World series (VCL and Firemonkey)”
Comments are closed.