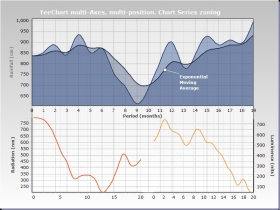
How TeeChart Charting Components can help you understand your data
Plug your data straight into TeeChart and select from more than 40 inbuilt indicators to analyse your financial, scientific or just about any other form of data. TeeChart presents a gallery of possible indicator types to you and asks what dataset you'd like to track ... the rest is automatic. If you have you own indicator definition that's ok too, TeeChart allows you to feed-in your definition to plot the result.
TeeChart indicator (or function-type) selection may be made via the TeeChart Editor, requiring no coding at all by the developer. That's great too for the end-userbase of your developed application, as new analysis modes may be selected and viewed according to the needs of the moment. There are a couple of articles explaining how to work with TeeChart functions amongst the Steema reference articles.
