For 2012 TeeChart for NET includes the new Series Type EquiVolume and enhancements to Point & Figure. Following updates will include further enhancements to other financial series. We expect the developments to be available on other TeeChart versions soon.
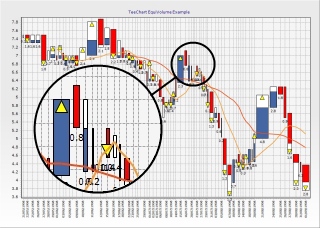
EquiVolume shows trade volume by varying point width and shows market price movement in a manner similar to conventional candle and OHLC Series. The new seriestype includes addiional highlights to show increasing and decreasing volume tendencies. TeeChart's Point & Figure Series has been enhanced in the TeeChart for .NET Chart and now includes auto gridding for points, month markers, High-Low as well as Close price plotting and Average True Range (ATR) Box sizing.