Delphi Gestures with TeeChart

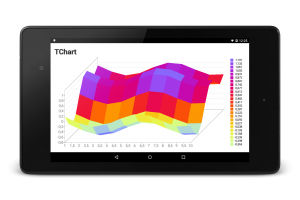
Since Embarcadero introduced touch screen support, the way gestures are being handled has evolved. Now that we are in the RAD Studio XE8 days, it has become pretty straightforward as documented in their “Gesturing Overview” article.

DelphiGestures

That article lays out the foundation on how to work with touch gestures and controls. Applying that to TeeChart, means we’ll need TChart and TGestureManager components. TGestureManager, which manages all the gestures that can be used by the control, will have to be associated to TChart’s Touch property. There you can choose which gestures will be associated with the control. There are three kinds of gestures: standard, custom and interactive. The example discussed is based on Delphi’s interactive gestures example.

Here you can download the full project used for the article. Now I’ll explain how to create it. Before starting to write code, please do the following at design-time: add a TChart component, add a TGestureManger component, passing the gesture manager to TChart‘s Touch property and enable Zoom, Pan and DoubleTap interactive gestures on it.

Once this is done, it’s time to start typing code. First of all we’ll deactivate some TeeChart standard interactions so they don’t interfere with the functionality gestures will implement. So we will disable default zoom and panning in form’s OnCreate event:

procedure TForm1.FormCreate(Sender: TObject);
var
  Series1: TSurfaceSeries;
begin
  Series1 := TSurfaceSeries.Create(Self);
  Series1.FillSampleValues(10);
  Series1.UseColorRange := False;
  Series1.UsePalette := True;
  Series1.PaletteStyle := psStrong;

  Chart1.AddSeries(Series1);
  Chart1.Zoom.Allow := False;
  Chart1.Panning.Active := False;
  Chart1.Chart3DPercent := 50;

  with TFlatTheme.Create(Chart1) do
  try
    Apply;
  finally
    Free;
  end;
end;

After that, it’s the turn of TChart‘s OnGesture event implementation:

procedure TForm1.Chart1Gesture(Sender: TObject;
  const EventInfo: TGestureEventInfo; var Handled: Boolean);
begin
  if EventInfo.GestureID = igiZoom then
    handleZoom(EventInfo)
  else if EventInfo.GestureID = igiPan then
    handlePan(EventInfo)
  else if EventInfo.GestureID = igiDoubleTap then
    handleDoubleTap(EventInfo);

  Handled := True;
end;

We are checking for TInteractiveGestures gestures performed on the chart, using event’s TGestureEventInfo, and implement a specific gesture handler method for each one. Finally, we set the Handled parameter to True so that the event is not propagated further.

Let’s speak about gesture handler methods now, starting with zoom:

procedure TForm1.handleZoom(EventInfo: TGestureEventInfo);
var
  LObj: IControl;
  chart: TChart;
  zoom: Double;
begin
  LObj := Self.ObjectAtPoint(ClientToScreen(EventInfo.Location));
  if LObj is TChart then
  begin
    if not(TInteractiveGestureFlag.gfBegin in EventInfo.Flags) then
    begin
      chart := TChart(LObj.GetObject);
      zoom := (EventInfo.Distance / FLastDIstance) * chart.Aspect.ZoomFloat;
      chart.Aspect.ZoomFloat := Max(10, zoom);
    end;
  end;
  FLastDIstance := EventInfo.Distance;
end;

Here we are implementing something different and simpler than the standard zoom in TeeChart. It’s based on the difference between the current distance and pinch that the gesture provides and the distance saved from previous calls, not allowing a zoom factor smaller than 10% of the original size.

Let’s continue with the pan gesture which, in this example, will be used for rotating the chart instead of panning it:

procedure TForm1.handlePan(eventInfo: TGestureEventInfo);
var
  LObj: IControl;
  chart: TChart;
begin
  LObj := Self.ObjectAtPoint(ClientToScreen(EventInfo.Location));
  if LObj is TChart then
  begin
    if not(TInteractiveGestureFlag.gfBegin in EventInfo.Flags) then
    begin
      chart := TChart(LObj.GetObject);

      chart.Aspect.Orthogonal := False;
      chart.Aspect.RotationFloat := chart.Aspect.RotationFloat + (EventInfo.Location.X - FLastPosition.X);
      chart.Aspect.ElevationFloat := chart.Aspect.ElevationFloat - (EventInfo.Location.Y - FLastPosition.Y);
    end;

    FLastPosition := EventInfo.Location;
  end;
end;

Similar to the pinch zoom gesture, here displacement (calculated from the screen position) is being used to rotate and elevate the chart.

Finally, the double tap gesture:

procedure TForm1.handleDoubleTap(eventInfo: TGestureEventInfo);
var
  LObj: IControl;
begin
  LObj := Self.ObjectAtPoint(ClientToScreen(EventInfo.Location));
  if LObj is TChart then
    ResetChart(TChart(LObj.GetObject));
end;

procedure TForm1.ResetChart(chart: TChart);
begin
  chart.Aspect.Orthogonal := True;
  chart.Aspect.ZoomFloat:=100;
  chart.Aspect.ElevationFloat:=345;
  chart.Aspect.RotationFloat:=345;
end;

It’s only used for resetting chart properties to their original values.

I hope this example is useful to illustrate the possibilities TeeChart has with multi-touch gesture on touch devices. It only covers a few cases but this opens up the possibility to a new world of charting interactions.

Here’s the complete code listing for the example discussed in this article:

unit Unit1;

interface

uses
  System.SysUtils, System.Types, System.UITypes, System.Classes, System.Variants,
  FMX.Types, FMX.Controls, FMX.Forms, FMX.Graphics, FMX.Dialogs,
  FMX.Controls.Presentation, FMX.StdCtrls, FMXTee.Engine, FMXTee.Procs,
  FMXTee.Chart, FMXTee.Series, FMXTee.Commander, FMX.Gestures,
  FMXTee.Series.Surface, FMXTee.Themes;

type
  TForm1 = class(TForm)
    Chart1: TChart;
    GestureManager1: TGestureManager;
    procedure FormCreate(Sender: TObject);
    procedure Chart1Gesture(Sender: TObject; const EventInfo: TGestureEventInfo;
      var Handled: Boolean);
  private
    { Private declarations }
    FLastPosition: TPointF;
    FLastDistance: Integer;
    procedure handleZoom(eventInfo: TGestureEventInfo);
    procedure handlePan(eventInfo: TGestureEventInfo);
    procedure handleDoubleTap(eventInfo: TGestureEventInfo);
    procedure ResetChart(chart: TChart);
  public
    { Public declarations }
  end;

var
  Form1: TForm1;

implementation

{$R *.fmx}

uses System.Math;

procedure TForm1.Chart1Gesture(Sender: TObject;
  const EventInfo: TGestureEventInfo; var Handled: Boolean);
begin
  if EventInfo.GestureID = igiZoom then
    handleZoom(EventInfo)
  else if EventInfo.GestureID = igiPan then
    handlePan(EventInfo)
  else if EventInfo.GestureID = igiDoubleTap then
    handleDoubleTap(EventInfo);

  Handled := True;
end;

procedure TForm1.FormCreate(Sender: TObject);
var
  Series1: TSurfaceSeries;
begin
  Series1 := TSurfaceSeries.Create(Self);
  Series1.FillSampleValues(10);
  Series1.UseColorRange := False;
  Series1.UsePalette := True;
  Series1.PaletteStyle := psStrong;

  Chart1.AddSeries(Series1);
  Chart1.Zoom.Allow := False;
  Chart1.Panning.Active := False;
  Chart1.Chart3DPercent := 50;

  with TFlatTheme.Create(Chart1) do
  try
    Apply;
  finally
    Free;
  end;
end;

procedure TForm1.handleDoubleTap(eventInfo: TGestureEventInfo);
var
  LObj: IControl;
begin
  LObj := Self.ObjectAtPoint(ClientToScreen(EventInfo.Location));
  if LObj is TChart then
    ResetChart(TChart(LObj.GetObject));
end;

procedure TForm1.handlePan(eventInfo: TGestureEventInfo);
var
  LObj: IControl;
  chart: TChart;
begin
  LObj := Self.ObjectAtPoint(ClientToScreen(EventInfo.Location));
  if LObj is TChart then
  begin
    if not(TInteractiveGestureFlag.gfBegin in EventInfo.Flags) then
    begin
      chart := TChart(LObj.GetObject);

      chart.Aspect.Orthogonal := False;
      chart.Aspect.RotationFloat := chart.Aspect.RotationFloat + (EventInfo.Location.X - FLastPosition.X);
      chart.Aspect.ElevationFloat := chart.Aspect.ElevationFloat - (EventInfo.Location.Y - FLastPosition.Y);
    end;

    FLastPosition := EventInfo.Location;
  end;
end;

procedure TForm1.handleZoom(EventInfo: TGestureEventInfo);
var
  LObj: IControl;
  chart: TChart;
  zoom: Double;
begin
  LObj := Self.ObjectAtPoint(ClientToScreen(EventInfo.Location));
  if LObj is TChart then
  begin
    if not(TInteractiveGestureFlag.gfBegin in EventInfo.Flags) then
    begin
      chart := TChart(LObj.GetObject);
      zoom := (EventInfo.Distance / FLastDIstance) * chart.Aspect.ZoomFloat;
      chart.Aspect.ZoomFloat := Max(10, zoom);
    end;
  end;
  FLastDIstance := EventInfo.Distance;
end;

procedure TForm1.ResetChart(chart: TChart);
begin
  chart.Aspect.Orthogonal := True;
  chart.Aspect.ZoomFloat:=100;
  chart.Aspect.ElevationFloat:=345;
  chart.Aspect.RotationFloat:=345;
end;

end.
 

Theme persistence

2015 brings some aesthetic improvements for TeeChart VCL/FMX and .NET versions with the intention to make it easier for our users to create visually appealing charts. In this article I’m going to speak about difference aspects about new theme usage and possibilities in TeeChart VCL/FMX to accomplish that objective. The concept and the result is almost the same in TeeChart .NET. The only differences are mostly internal and hence transparent to the user.

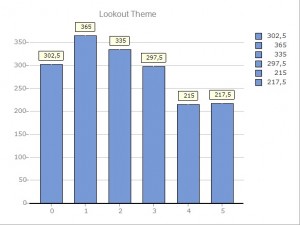
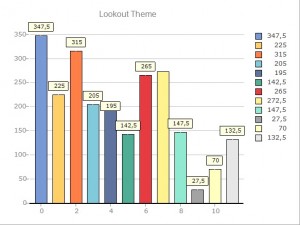
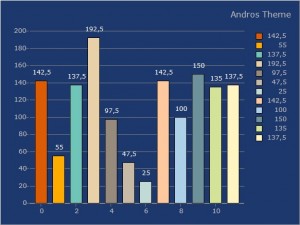
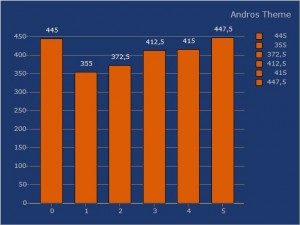
We’ve started by creating two new themes: Lookout and Andros, with their associated color palettes: Lookout and Seawash respectively. This is how those themes look when displaying the full color palette or single color series:

LookoutExample2
Lookout theme example with one single color series
LookoutExample
Lookout theme example showing all the colors in the so called Lookout palette
SeaWashExample
Andros theme example showing all the colors in the associated Seawash palette
AndrosExample
Andros theme example showing a series with one single color from the Seawash palette.

However, this is only the tip of the iceberg because new themes also come with more theme related internal functionality. That is, when a custom theme is applied to a chart, new objects (series, axes and tools) added to it will also inherit the aspect of those themed objects which already exist in the chart. This didn’t occur before. So, for example, if you add a new series to a chart with one of those themes, series in in the chart will perpetuate their settings to additional series added afterwards. An example can be seen in the chart below, an additional series to a chart with the Andros theme will set the series marks to be exactly in the same format without having to perform any custom setting by the user.

Andros2Series
All series in this chart share series marks custom settings without the need of any specific code.

In the VCL/FMX version this applies to series, tools and custom axes, for now.

Going even further, users can add their own themes by exporting the charts they created to the TeeChart native template  format (.tee files). There’s just one thing they should bear in mind is that for series to be “themed” they should be of a special type in the custom theme file, TThemedSeries. For example:

  //Add themed series
  Chart1.AddSeries(TThemedSeries.Create(Self)).FillSampleValues;
  
  for i:=0 to Chart.SeriesCount-1 do
  begin
    Chart[i].Marks.Arrow.Visible:=False;
    Chart[i].Marks.Transparent:=True;
    Chart[i].Marks.Font.Color:=clWhite;
    Chart[i].Marks.Font.Name:='Verdana';
    Chart[i].Marks.Font.Size:=9;
  end;

  //Export theme
  SaveTeeToFile(Chart1, SourceFolder + 'TeeAndrosTheme.tee');

Existing series in the chart can be switched to TThemedSeries using the self-explanatory ChangeSeriesType method.

Once the custom custom .tee templates are ready, they can be applied using TThemeList.Apply method from TeeThemes unit, for example:

TThemesList.Apply( DestinationChart, 'MyChart.tee' );

Worth noting that functionality described in this article is intended to be spread across all TeeChart versions in following releases throughout the year so stay tuned as new product updates start rolling out.

Steema at Xamarin Evolve 2014

Steema Software has confirmed its presence as an exhibitor at Xamarin Evolve 2014. In this article I’ll explain what Steema Software will be presenting at the conference.

Xamarin  is planning Evolve 2014 as “The world’s largest cross-platform mobile development”. It will be held in Atlanta from Monday 6th October until Friday 10th.

From the Steema team, Josep Lluís Jorge (aka Pep) and Narcís Calvet (yours truly) will attend Evolve 2014. Pep is the man behind the TeeChart for Xamarin.iOS version, while I’m the responsible for the TeeChart for Xamarin.Android version. We expect to arrive at the Atlanta Hyatt Regency, where Xamarin Evolve 2014 is held, on Sunday afternoon so we will be around from then until the end of the conference. On Monday and Tuesday we will probably attend some training sessions. On Tuesday we will also be setting up the Steema Software booth at the exhibitor area. So, from Wednesday until Friday you will be able to find us at the mentioned booth and, if work permits, at some of the conference sessions. We will check out and fly back home on Saturday afternoon so as such, we’ll have been able to spend the entire Evolve 2014 time in Atlanta.

And what will Steema Software present? We will be glad to show and talk with you about any of Steema’s charting products (.NET, VCL/FMX, Java, PHP, HTML5, etc.), especially the Xamarin charting components and also showing a preview of TeeChart for Xamarin.Forms. Hot of the press, just ready for Evolve 2104!

An important part of the Steema team is now working hard to get everything ready for the weekend for us to travel to Atlanta and be able to show you as much as possible. Pep and I are looking forward to see all of you at Evolve and get the most out of it. Please don’t hesitate to drop by the Steema booth or reach us anywhere else during our stay there, we will be happy to speak with you. If you want to arrange a meeting, or for us to prepare something you’d be interested in  or anything else, please drop me an email. We will be glad to help you.

See you at Evolve 2014!

Real-time charting with TeeChart for Xamarin.Android

To complete the zooming and panning functionality description in the multi-touch article, I should also speak about one last case which concerns real-time performance. Actually, this is not a zoom/pan style but the lack of it.  It’s the the TChart.Zoom.Style property value not covered on that article, ZoomStyles.None.

So, what does ZoomStyles.None consists of exactly?  It disables zooming and scrolling and its main priority is refreshing the chart at the highest rate possible for real-time purposes. This is achieved via multi-threading and forcing the chart to paint on the UI thread. For this to work the RunOnUiThread delegate need to be implemented in your real-time charting applications.

Before getting too abstract, let’s brake things into pieces. This article is based on the RealTimeCharting demo project shipped with TeeChart for Xamarin.Android evaluation and registered versions and also available at GitHub.  We will start setting up the chart with the minimum elements required to represent our data trying to add as little work for the CPU as possible and therefore get a more responsible application. As you can see in the code snippet below, this involves disabling: 3D, legend, gradient, walls, automatic axes range calculation, etc.

//Add the chart
tChart1 = new Steema.TeeChart.TChart(this);
tChart1.Aspect.View3D = false;
tChart1.Zoom.Style = Steema.TeeChart.ZoomStyles.None;
tChart1.Legend.Visible = false;
tChart1.Panel.Gradient.Visible = false;
tChart1.Walls.Back.Gradient.Visible = false;
tChart1.Walls.Back.Visible = false;
tChart1.Axes.Left.Grid.Visible = false;
tChart1.Axes.Bottom.Grid.Visible = false;
tChart1.Axes.Left.Automatic = false;
tChart1.Axes.Bottom.Automatic = false;
tChart1.Axes.Left.SetMinMax(MinValue, MaxValue);
tChart1.Axes.Bottom.SetMinMax(0, NumPoints);
tChart1.ClickSeries += new Steema.TeeChart.TChart.SeriesEventHandler(tChart1_ClickSeries);

//Left axis disabled for performance purposes.
tChart1.Axes.Left.Visible = false;

Besides setting the Zoom.Style to ZoomStyles.None, disabling some objects’ visibility and automatic axes range calculation, vertical axis is completely disabled to avoid it having to calculate labels or anything else that would require some precious computing time. Next thing to consider is the kind of chart style (we call it series in TeeChart) we will use for that kind of chart. This example uses a FastLine series, a specific line, reduced to the minimum expression for performance purposes.

var fastLine1 = new Steema.TeeChart.Styles.FastLine(tChart1.Chart);
fastLine1.FillSampleValues(NumPoints);
fastLine1.DrawAllPoints = false;

It’s also worth mentioning the use of the DrawAllPoints property in FastLine series. This property controls how many points in a FastLine series will be displayed. When True (the default), all points are displayed. When set to False, it will only display points that have a different “X” position in screen pixels. So, when the series has several points that share the same X pixel position, but with different Y position, it will only display the first point (or use another chosen method via DrawAllPointsStyle property). When set to True (the default), only points that have a different X or a different Y pixel position are displayed. In some cases, setting DrawAllPoints can dramatically speed up displaying a FastLine series with lots lots of points. But, as not all points are displayed, the final output might not be as accurate.

After having explained that, I should only add that, in this project initialisation, a timer is being created to add data to the chart at a fixed continuous rate simulating a real-time data capturing environment.

timer1 = new System.Timers.Timer();
timer1.Elapsed += new System.Timers.ElapsedEventHandler(timer1_Elapsed);
timer1.Interval = 100;
timer1.Start();

The event that the timer triggers just implements RunOnUiThread delegate, which calls a method (AnimateSeries) that updates the series in the chart.

void timer1_Elapsed(object sender, System.Timers.ElapsedEventArgs e)
{
  RunOnUiThread(delegate
  {
	AnimateSeries(tChart1);
  });
}

After the chart has been set up for work, the AnimateSeries method is where almost everything happens:

void AnimateSeries(Steema.TeeChart.TChart chart)
{
  var rnd = new Random();
  double newX, newY;

  tChart1.AutoRepaint = false;

  foreach (Steema.TeeChart.Styles.Series s in chart.Series)
  {
	// show only 50 points - delete the rest
	while (s.Count > NumPoints) s.Delete(0);
	if (s.Count > NumPoints) s.Delete(0);
	newX = s.XValues.Last + 1;
	newY = rnd.Next(MaxValue);
	if ((Math.Abs(newY) > MaxValue) || (Math.Abs(newY) < MinValue)) newY = 0.0;
	s.Add(newX, newY);
  }

  tChart1.Axes.Bottom.SetMinMax(tChart1.Axes.Bottom.Minimum + 1, tChart1.Axes.Bottom.Maximum + 1);
  
  tChart1.AutoRepaint = true;
  tChart1.Chart.Invalidate();
}

Besides generating some random data for the example chart, the most important thing here is the AutoRepaint property, which toggles chart repainting when new data is being added to the chart. To avoid the chart being repainted after every new point being added to it, we will disable it and will only enable it back, followed by a Chart.Invalidate() call, after all data has been added/removed from the series to force the chart being refreshed at this stage. In the meantime, if there are more points in the chart than those being specified by NumPoints constant, first points in the sequential range will be removed and new data will be added to the series in the same fashion. Finally, horizontal axis scale will be updated accordingly.

So we are done with it. In this article we have covered which are the basic TeeChart aspects you should consider modifying to get the most speed out of it. You probably know this is very important when handling large data volumes.

As mentioned at the beginning of the article, the complete example project is included with both TeeChart for Xamarin.Android evaluation and registered versions and also at the GitHub repository for the component. However, for clarity and completeness of purpose, here’s the complete code listing:

using System;

using Android.App;
using Android.OS;
using Android.Views;
using Android.Widget;

namespace RealTimeCharting
{
  [Activity(Label = "RealTimeCharting", MainLauncher = true, Icon = "@drawable/icon")]
  public class Activity1 : Activity
  {
    Steema.TeeChart.TChart tChart1;
    const int NumPoints = 50;
    const int MinValue = 0;
    const int MaxValue = 1000;
    System.Timers.Timer timer1;

    protected override void OnCreate(Bundle bundle)
    {
      base.OnCreate(bundle);

      // Set our view from the "main" layout resource
      SetContentView(Resource.Layout.Main);

      // Get our button from the layout resource,
      // and attach an event to it
      Button button = FindViewById

Multi Touch with TeeChart for Xamarin.Android

Now that you know how to get started with TeeChart for Xamarin.Android, let’s get into a more interesting topic, multi-touch with TeeChart and Xamarin.Android.

From its inception, TeeChart for Xamarin.Android supports multi-touch gestures. However, since the release of build 4.14.6.25 in June 2014, the multi-touch offering has been extended with the implementation of the entire ZoomStyles.Classic functionality. In this article we will explain the different options presented to the programmer/user and what they can offer.

There are several ways to perform zooming and panning with TeeChart for Xamarin.Android. The door to the different possibilities is the TChart.Zoom.Style property. So we will elaborate on each specific value of Steema.TeeChart.ZoomStyles enum.

ZoomStyles.Classic

This is the most complete and versatile option available and the one which came the latest, as mentioned above. Choosing it the chart will zoom and scroll in a very similar way to the desktop version. However, instead of pressing a mouse button and drawing the zoom rectangle while dragging the mouse over the chart, it will respond to pinch gestures zooming the chart according to the virtual rectangle comprised between two finger pointers. This means dragging the fingers apart will zoom in the chart while closing them together will zoom the chart out. I must add this is automatically activated when two pointers are pressing the chart. If only one single pointer is pressing it panning will be activated instead. Actually, this is not 100% true, those options will be automatically activated only if the Allow property is also active (e.g.: TChart.Zoom.Allow and TChart.Panning.Allow). A little code snippet will help understanding this better:

tChart1.Zoom.Allow = true;
tChart1.Zoom.Direction = Steema.TeeChart.ZoomDirections.Both;
tChart1.Panning.Allow = Steema.TeeChart.ScrollModes.Horizontal;

The chart in the code above will be allowed to zoom in horizontal and vertical directions while will only allow scrolling in horizontal directions. Zoom has Allow and Direction self-explanatory properties, Panning does everything with one single property. To disable panning one should use Steema.TeeChart.ScrollModes.None. BTW, should ask to the TeeChart “fathers” about the reason behind this difference! writing this article has been useful to rethink this, deprecate Zoom.Allow property and add a new ZoomDirections.None enum value for Zoom.Direction property. Having that in mind, versions published after mid-July 2014 should use this code instead:

tChart1.Zoom.Direction = Steema.TeeChart.ZoomDirections.Both;
tChart1.Panning.Allow = Steema.TeeChart.ScrollModes.Horizontal;

Finally, double tapping on the screen will undo any scroll or zooming action.

So, in resume, this options includes exactly the same functionality as the desktop version and gives complete control to the user about which scaling or translation will the chart perform.

ZoomStyles.FullChart

The two following options are simpler and are based on image scaling and translation instead of drawing directly to the chart canvas as the previous option does. So, FullChart will also perform to pinch and drag gestures but scrolling or zooming the chart as an image in its entirety.

ZoomStyles.InChart

This adds some sophistication to the FullChart option. Internally it separates the chart in 4 areas: background, chart rectangle, left axis and bottom axis. This is because when zooming or scrolling, performing pinch or drag gestures, on the chart rectangle (the area comprised between the axes where the series are being painted), this area will be transformed as an image, as ZoomStyles.FullChart but, this time, axes will also be transformed as individual images to keep in synch with the chart rectangle. The chart background won’t be affected by those changes. So, all in all, this is some kind of hybrid version between ZoomStyles.Classic and ZoomStyles.FullChart.

ZoomStyles.None

This option won’t allow zooming nor scrolling the chart. This is only intended for real-time charting applications where performance is optimized and therefore, zooming and panning not allowed. It’s not only that some chart settings are modified to optimise performance but the way the chart is internally painted also changes. Threads running on the UI should be used to add data to the chart and refresh it for real-time smoothness. An example of this can be seen in the RealTimeCharting example included with both evaluation and registered versions.

Summary

In a nutshell, in this article we can see that TeeChart for Xamarin.Android supports a varied multi-touch offering to fit a wide range of requirements, giving many options to the programmer/user. It’s also worth mentioning all of this doesn’t forget touch events on the chart and series!

Getting started with TeeChart for Xamarin.Android

It’s been some time now since TeeChart for Xamarin.Android was released, in August 2012, following the path Xamarin started drawing about one year before. While Xamarin has made huge progress during this time, the corresponding TeeChart version has also evolved and improved correspondingly.

If you are reading this, you have probably already got started with Xamarin.Android. We will elude the Xamarin products details and focus on using TeeChart on them.

Xamarin Studio

After creating a new blank Android application, the easiest and fastest way is by using the TeeChart version in the Xamarin Component Store. Here’s a Xamarin guide on how to use it. Let’s apply that to TeeChart now. In an Android application, choose Project > Edit Components > Open Component Store (or Get More Components). This will load the component store for you:

ComponentStore

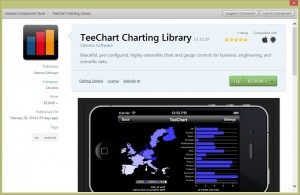
In the image above, you can see the TeeChart Charting Library as the 5th overall option. You can also find it in the Libraries category or find it with the given search option. Anyway, selecting the TeeChart Charting Library takes you to this screen:

TeeChartComponentStore

Besides the product info, getting started link, license, etc. there are two green buttons here. They will let you either evaluate the component or purchase it. A couple of things to comment on here. First, the evaluation version is fully functional and the only limitation you’ll experience with it is a watermark over the charts. Secondly, the evaluation and registered versions are also available at www.steema.com. Later on I will explain how to use the components outside the Component Store but now let’s continue with that. To do so I’ll choose the Try button option.

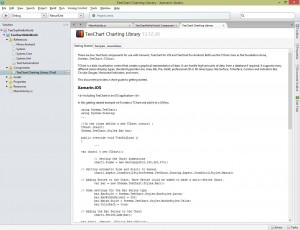
After agreeing to the licensing terms, this will add the TeeChart for Xamarin.Android trial version to your project, as an item in the Components folder and also as a TeeChart.Android.dll assembly reference in the References folder. The “references” part is all we will have to take care of to use TeeChart.Android.dll from outside the Component Store. The TeeChart entry in the Components list will also open the corresponding tab in Xamarin Studio’s main window:

TeeChartProjectComponents

The aforementioned TeeChart tab has 3 sub tabs: Getting Sarted, Samples and Assemblies. Actually, those names are self-explanatory. The first one contains some basic information and code snippets to get you started quickly on developing Android applications with TeeChart. The second one includes sample projects for iOS and Android. The third tab contains information about the assemblies included with the component and their version.

Prior to start to develop our own application, we will try with the Android example by pressing the corresponding button in the Samples tab. Doing so will add the MonoAndroidDemo project to our solution. The example project comes with a reference to the TeeChart.Android.dll we have chosen (trial or registered) and is ready to run on your emulator or device of choice.

Now, back to the Getting Started tab, there’s a little Android code snippet which we can copy and paste at the OnCreate method on our Activity:

protected override void OnCreate (Bundle bundle)
{
	base.OnCreate (bundle);

	Steema.TeeChart.TChart tChart1 = new Steema.TeeChart.TChart(this);        
	Steema.TeeChart.Styles.Bar bar1 = new Steema.TeeChart.Styles.Bar();       
	tChart1.Series.Add(bar1);        
	bar1.Add(3, "Pears", Color.Red);       
	bar1.Add(4, "Apples", Color.Blue);       
	bar1.Add(2, "Oranges", Color.Green);        
	Steema.TeeChart.Themes.BlackIsBackTheme theme = new Steema.TeeChart.Themes.BlackIsBackTheme(tChart1.Chart);       
	theme.Apply();        
	SetContentView(tChart1);
}

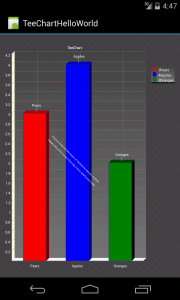
So now we have our first TeeChart for Xamarin.Android application ready to go.

GettingStartedSample

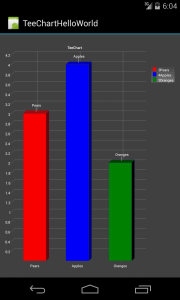
Let me explain what those lines of code exactly mean. We start creating a TChart object, the basic object of the component set, which is the chart container. A Bar series comes after, it’s created and added to the chart component. After that, some bars are added to the bar series: Y values, text labels and bar colors. Afterwards a chart theme is created and applied to the chart to change the overall aspect. Finally, the chart component is added to fill the parent view entirely. Getting a chart into your Android application is as simple as that.

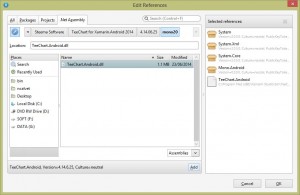
If are no not using the Xamarin Component Store because you are using a TeeChart.Android.dll downloaded directly from Steema it wouldn’t be that much different. You just have to manually browse for TeeChart.Android.dll in your hard drive at the References folder in your project: References > right mouse button -> Edit References > .Net Assembly. Here you’ll need to browse for the assembly in your disk and add it to the project.

ManualReference

Changing from the trial version assembly from the Component Store to the registered version I have on my computer, I now get the same example without the evaluation watermark.

GettingStartedSampleRegistered

Visual Studio

There are no substantial differences on the basics of creating Android projects in Xamarin Studio and Visual Basic. As Xamarin explains in the Components Walkthrough article, Component Store is being used the same way in Visual Studio. A Components is added to each project. From there you can access the store with your Xamarin license credentials. Also, manually adding the assembly references to your project works very much the same way.

Summary

Now that you know how to use TeeChart in your C# Android applications, you are all good to start representing your data graphically in Android with C#. TeeChart for Xamarin.Android installers for Windows and Mac OSX, supplied by Steema Software, include some more demos, help files and a number of tutorials completing a wide range of TeeCharting aspects. Also, at the Steema Support forums for registered customers, you’ll find a huge number of questions with examples covering almost aspects of TeeChart. Non-registered users can post their technical inquiries at StackOverflow tagged with “TeeChart” and the platform/language.

If you are a native Java Android developer, Steema Software also has a native component for you, TeeChart Java for Android. Those targeting Android from Embarcadero IDEs, can use the TeeChart VCL/FMX version.

Converting VCL/FMX and ActiveX templates to .NET.

Over the years, a number of TeeChart users have asked how to convert the charts they created either using TeeChart VCL/FMX or ActiveX to the .NET version, enabling them to more easily port their previously created charting projects to .NET.

Well, this is possible! It might not be the ideal or perfect solution but it’s an approximation that can save you some work. This can be achieved in two ways:

  1. Using the TeeToTen application. It is a .NET application that uses TeeChart ActiveX to load the .tee files (TeeChart VCL/FMX and ActiveX templates), convert them to text files, generate an XML file with series and data and then load them into a .NET chart  which is then used to generate the .ten file (TeeChart .NET templates) file. The tool comes with a readme.txt document that explains which are its prerequisites and how to use it. TeeToTen tool can also be called via command line with several parameter options. This way it can be called from your applications to obtain a completely automatic conversion. Full details on how to use it are available at included readme.txt.
  2. This solution by-passes the ActiveX version and uses TeeToText, a small VCL application that loads .tee files and generates the necessary text and XML files. Actually, anybody that uses TeeChart VCL/FMX or TeeChart ActiveX can easily generate such files using their built in exporting functionalty, which is what TeeToText does. Once the process is complete,  you need to use TenCreator.dll included with TeeToTen  to import these generated files into your .NET chart. Here’s an example of TenCreator.dll being used to convert one file:
string chartFile = @"C:\temp\TemplateSamples\Annotations.txt";
string dataFile = @"C:\temp\TemplateSamples\Annotations.xml";

TenCreator.TenStreamer streamer = new TenCreator.TenStreamer();
System.IO.Stream netStream = streamer.ConvertFile(chartFile, dataFile);
netStream.Position = 0;
tChart1.Import.Template.Load(netStream);
tChart1.Export.Template.Save(@"C:\TemplateSamples\Annotations.ten");

and here’s an example converting a complete folder:

public Form1()
{
    InitializeComponent();
    InitializeChart();
}

private void InitializeChart()
{
    DirectoryInfo dFolder = new DirectoryInfo(@"C:\TemplateSamples");
    SearchOption so = new SearchOption();
    bool incSubDirectories = false;

    if (incSubDirectories)
    {
        so = SearchOption.AllDirectories;
    }
    else
    {
        so = SearchOption.TopDirectoryOnly;
    }

    FileInfo[] fFileArray = dFolder.GetFiles("*.tee", so);

    foreach (FileInfo fFile in fFileArray)
    {
        ConvertFile(fFile.FullName);
    }
}

private void ConvertFile(string fileName)
{
    string chartFile = fileName.Replace(".tee", ".txt");
    string dataFile = fileName.Replace(".tee", ".xml");

    TenCreator.TenStreamer streamer = new TenCreator.TenStreamer();
    Stream netStream = streamer.ConvertFile(chartFile, dataFile);
    netStream.Position = 0;
    tChart1.Import.Template.Load(netStream);
    tChart1.Export.Template.Save(fileName.Replace(".tee", ".ten"));
}

This project is a work in progress. It’s being improved upon user demand so feel free to let us know your feedback at info at steema dot com.  We hope this helps in the transition of your existing projects that use TeeChart to the .NET platform.

How to make a transparent chart with TeeChart Pro ActiveX

While part of the Steema team was at the Mobile World Congress and WIPJam events in Barcelona, getting acquainted with the novelties on the mobile sector, some of us remained at the office in Girona working on some vintage stuff, let’s call it.

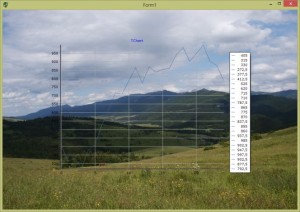
Over the years, one of  the recurring questions with TeeChart Pro VCL/FMX has been how to create a transparent chart. We have an old Delphi demo project which accomplishes this. It consists of an image in a form and a chart over it. The goal is to make the chart transparent so that the image can be seen through the chart background. This is achieved by first making the chart back wall transparent and then, generating a bitmap the size of the chart from the background image at the chart location and drawing it on the TChart canvas. This process produces a chart like that:

Chart with a transparent background in Delphi.

which still is an interactive chart which responds to mouse action: clicks, zoom, panning, etc.

Pretty simple in Delphi, huh? Now let’s complicate things a little bit. We were faced with the question of how to do the same with TeeChart ActiveX. Actually, I don’t know why this didn’t come up before or, if it had been asked for, I was not aware of it. Anyway, this wouldn’t have sounded that complicated if it hadnn’t been because it ended up being a Frankenstein project, since it needed to be TeeChart Pro ActiveX in VB.NET. So a nice COM/.NET mix. Well, this may not make a Frankenstein but wait, the sophistication doesn’t end here. As you may already know, TeeChart Pro ActiveX is a COM wrapper of the TeeChart Pro VCL/FMX version, so an intriguing mixture of Delphi (VCL) code with ActiveX objects and .NET methods/properties. It doesn’t sound  that straightforward now, does it?

Ok, let’s break things into different parts and will see how the original Delphi code was literally ported to VB with TeeChart ActiveX. First of all, setting the chart panel to be transparent gets somewhat complicated when mixing ActiveX and .NET worlds:

AxTChart1.Panel.Color = Convert.ToUInt32(ColorTranslator.ToOle(Color.Transparent))

That tricky conversion is the only remarkable part of initial chart settings. The substantial code is in the OnBeforeDrawChart event though. That’s how it looks like in Delphi:

procedure TForm1.Chart1BeforeDrawChart(Sender: TObject);
begin
	if not Assigned(Back) then
	begin
		Back:=TBitmap.Create;
		Back.Width:=Chart1.Width;
		Back.Height:=Chart1.Height;

		Back.Canvas.CopyRect(Chart1.ClientRect,Canvas,Chart1.BoundsRect);
	end;

	if Chart1.Color=clNone then
		Chart1.Canvas.Draw(0,0,Back);
end;

All that fuss for about 10 lines of code!? Well, first I should admit that Steema’s .NET language of choice is C#. So I have some difficulties converting C# to VB. Luckily, most of them are solved using Carlos Aguilar’s VB to (and from) C# code translator. You’ll also notice that I’m not an expert on code formatting in WordPress either. I must admit this is my very first article and found that Posting Source Code suggested solution doesn’t work very well for me. I hate poorly indented code so any help on this will be appreciated.

Ok, back on track, I needed to find out which is the equivalent method of Delphi’s CopyRect, which basically copies a part of an image into another image canvas. This can be done with System.Drawing.Graphics.DrawImage method. It has several overloads so I had to find out the one that does the same as CopyRect in Delphi. The most similar overload I could find is this. With a little help from a search engine I found that that simple Delphi call would turn out to be another 10 line method in VB:

Private Function CopyRect(ByVal srcBitmap As Bitmap, _
	ByVal destRect As Rectangle, ByVal srcRect As Rectangle) As Bitmap

	' Create the new bitmap and associated graphics object
	Dim bmp As New Bitmap(srcRect.Width, srcRect.Height)
	Dim g As Graphics = Graphics.FromImage(bmp)

	'Draws the specified portion of the specified Image at the specified location and with the specified size.
	g.DrawImage(srcBitmap, destRect, srcRect, GraphicsUnit.Pixel)

	' Clean up
	g.Dispose()

	' Return the bitmap
	Return bmp
End Function

It would look like I was halfway done but I found that I was completely wrong. ActiveX controls don’t have ClientRect property that Delphi controls have. I also had to manually create BoundsRect. Nothing complicated but something the almighty Delphi also did for me:

Dim ClientRect As Rectangle = New Rectangle(0, 0, AxTChart1.Width, AxTChart1.Height)
Dim ChartBounds As Rectangle = New Rectangle(AxTChart1.Location.X, AxTChart1.Location.Y, _
											 AxTChart1.Width, AxTChart1.Height)

So now that all the elements are in place, I just needed to paint the resulting bitmap to TeeChart’s canvas. But wait, another ActiveX vs .NET trick was still waiting for me. Calling Canvas.Draw on TeeChart ActiveX with a .NET Framework native System.Drawing.Bitmap was showing a warning about an image format conversion issue. Besides of that, I decided to go ahead but the warning turned to a run-time error. I had to convert the .NET bitmap to a stdole.IPictureDisp. Thanks to this article I learned that I had to create an additional class derived from AxHost to have access to some private methods of this class that would do the conversion for me. I copied the class, converted it to VB with the mentioned code translator and I was all set to paint the image into TeeChart’s canvas:

If AxTChart1.Panel.Color = Convert.ToUInt32(ColorTranslator.ToOle(Color.Transparent)) Then
	Dim backImage As stdole.IPictureDisp = AxHostConverter.ImageToPictureDisp(Back)
	AxTChart1.Canvas.Draw(0, 0, backImage)
End If

Now all code was complete and I could run and see the result. I went for it and, to my deception, I found that the image from the picture box was always in the original size; it didn’t come out with the stretching method I was using:

PictureBox1.SizeMode = PictureBoxSizeMode.StretchImage

Once again, Delphi handled this nicely without having to implement any additional code. So, time to scratch my head a little bit more and thanks to internet, I found that I had to create an intermediate image with the stretched image dimensions which resulted in this method:

Private Function GetStretchedImage(ByVal image As Image) As Bitmap
	If PictureBox1.SizeMode = PictureBoxSizeMode.StretchImage Then
		Dim bmp As Bitmap = New Bitmap(PictureBox1.Width, PictureBox1.Height)

		Dim g As Graphics = Graphics.FromImage(bmp)
		g.InterpolationMode = Drawing2D.InterpolationMode.NearestNeighbor
		g.DrawImage(image, New Rectangle(Point.Empty, bmp.Size))

		Return bmp
	Else
		Return image
	End If
End Function

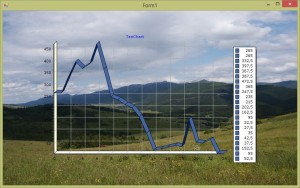
Phew! This finally produced the result I expected and what was so simple to do in Delphi:

TransparentActiveXNET

Didn’t I tell you it was some sort of Frankenstein example? If you are interested in seeing all the nuances in detail you can download the complete project. You’ll need TeeChart Pro ActiveX 2014 to run it. A fully functional evaluation version can be download at the TeeChart ActiveX downloads page.