TeeChart VCL for Borland/CodeGear/Embarcadero RAD Studio, Delphi and C++ Builder.
-
X-ray
- Newbie

- Posts: 27
- Joined: Fri Apr 16, 2010 12:00 am
Post
by X-ray » Wed Jun 16, 2010 9:10 am
Hi,
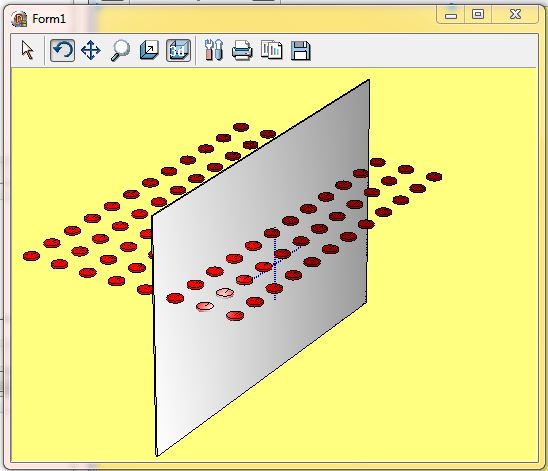
based on some 3 dimensional information I draw a plate and on top of it pie charts in certain X.Y postions.
The X,y postions for the Pie charts are enforced/aligned using TChart.ChartRect.
In previous versions of TChart (like V8.06) the Pie charts were aligned along the X, Y plane now the pie charts are
oviously aligned differently. Is there any fix for that?
Attached there is a small example application that shows the problem.
best regards,
X-Ray
- WrongPieChartAlignment.JPG (45.65 KiB) Viewed 12301 times
-
Attachments
-
- PieChartAlignmentBug.zip
- (9.09 KiB) Downloaded 430 times
-
Narcís
- Site Admin

- Posts: 14730
- Joined: Mon Jun 09, 2003 4:00 am
- Location: Banyoles, Catalonia
-
Contact:
Post
by Narcís » Fri Jun 18, 2010 11:03 am
Hi X-Ray,
I'm afraid this is a v2010 bug with OpenGL canvas. I have added it (TV52014983) to the defect list to be fixed. You can reproduce the same with the All Features\Welcome !\Chart Styles\Standard\Pie\Multiple Pies example in the new features demo, available at TeeChart's program group. You just need to right-click on the bottom bar in the demo, choose OpenGL canvas, add a Rotate tool to the chart (double-clicking on the yellowish memo to open the chart editor) and finally rotate the chart. The problem seems to be when modifying ChartRect, it uses X-Z plane instead of the X-Y plane as it does in v8.
-
X-ray
- Newbie
- Posts: 27
- Joined: Fri Apr 16, 2010 12:00 am
Post
by X-ray » Fri Jun 18, 2010 12:03 pm
Hi Narcis,
thanks for the analysis.
Do you think this bug will be fixed in the next maintenance release?
Otherwise can you give me a hint in which unit and procedure I have to look (approximately) to fix it?
best regards,
X-ray
-
Narcís
- Site Admin
- Posts: 14730
- Joined: Mon Jun 09, 2003 4:00 am
- Location: Banyoles, Catalonia
-
Contact:
Post
by Narcís » Fri Jun 18, 2010 2:22 pm
Hi X-ray,
Do you think this bug will be fixed in the next maintenance release?
I'm sorry but I'm not able to confirm that in the present moment.
Otherwise can you give me a hint in which unit and procedure I have to look (approximately) to fix it?
I think this is an OpenGL canvas problem. Hence you should look at TeeOpenGL.pas and TeeGLCanvas.pas. Probably I'd start looking at TGLCanvas.Pie3D method but I should investigate the issue further to be able to confirm that.
-
X-ray
- Newbie
- Posts: 27
- Joined: Fri Apr 16, 2010 12:00 am
Post
by X-ray » Mon Sep 13, 2010 8:58 am
Hi TChart Team,
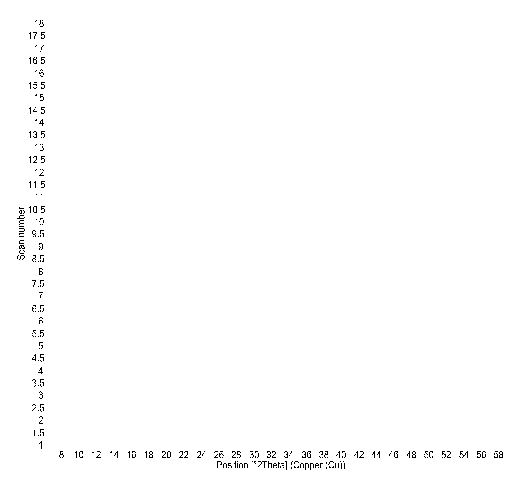
I just tested the new TChart 2010 maintenance release and I was really disappointed by the fact that this serious bug is still not solved!
Furthermore more serious bugs were introduced for example now a TColorGridSeries that used to work nicely under all previous versions doesn't show up anymore, just the axes are shown (see attachment).
Now again I have to spend precious time and create a "small example application" that shows this bug.
Is there at least a workarround for the 3D alignment bug?
best regards,
X-Ray
-
Attachments
-
- Capture.JPG (20.55 KiB) Viewed 12218 times
-
X-ray
- Newbie
- Posts: 27
- Joined: Fri Apr 16, 2010 12:00 am
Post
by X-ray » Mon Sep 13, 2010 10:50 am
Hi TChart Team,
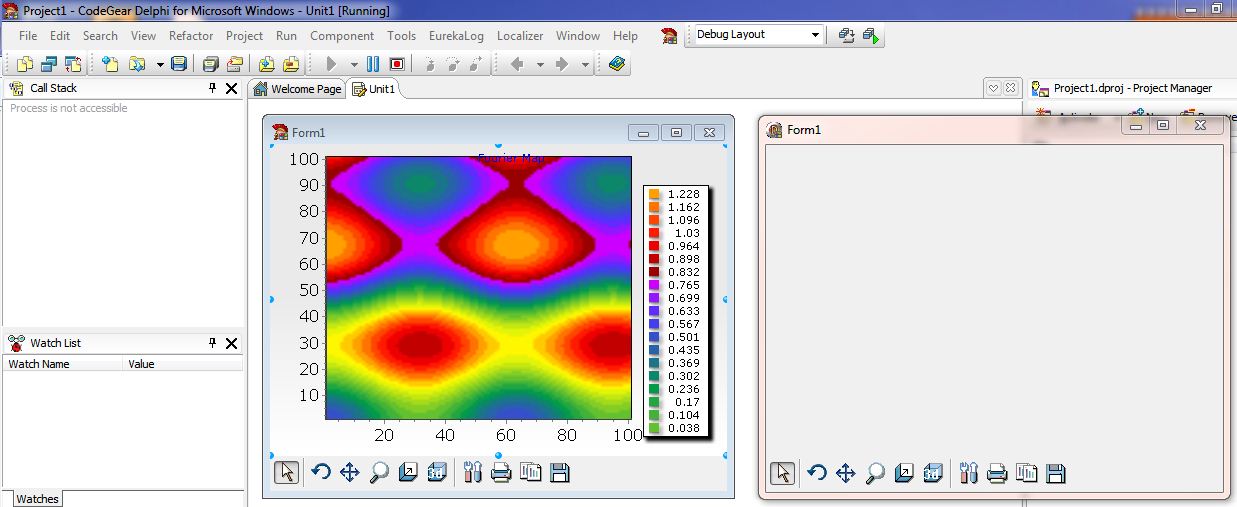
I created an example application to show the Colorgrid bug.
Design time in Delphi 2007 the cologrid displays fine but the executable shows nothing (Of course after populating the the color grid series with random data!)
- Capture.JPG (94.52 KiB) Viewed 12221 times
Attached you find the example project and the compiled executable.
best regards,
X-Ray
-
X-ray
- Newbie
- Posts: 27
- Joined: Fri Apr 16, 2010 12:00 am
Post
by X-ray » Mon Sep 13, 2010 12:06 pm
Somehow the zip file was not attached/accepted. Now I have added a ZIP file containing just the sources of the example project and no executable.
-
Attachments
-
- ColorGridBugJustSources.zip
- (8.42 KiB) Downloaded 406 times
-
Yeray
- Site Admin
- Posts: 9544
- Joined: Tue Dec 05, 2006 12:00 am
- Location: Girona, Catalonia
-
Contact:
Post
by Yeray » Wed Sep 15, 2010 9:21 am
Hi X-ray,
I've seen that in your dfm there is the following line:
Deleting it I can see the chart, and adding some values to the ScanColorGridSeries, I can see it without problems.
-
X-ray
- Newbie
- Posts: 27
- Joined: Fri Apr 16, 2010 12:00 am
Post
by X-ray » Wed Sep 15, 2010 10:28 am
Hi Yeray,
you are right concerning the example application. This is the problem there but the real problem in my applcation which occured after installing the maintenance release persists as you can see on the previous sceen shot where the axes are both visible but the data is invisible. So still left with the work to create an example application to isolate the bug.
I tried it by saving a .tee file but this also doesn't help to show this bug. But it does show another one. The graphics extends beyond the Y axis (you can see that by loading the attached .tee file):
- Capture.JPG (58.76 KiB) Viewed 12154 times
You didn't answer the question concerning the 3D alignment bug?
best regards,
X-Ray
-
Attachments
-
- ColorGridBugDataTee.zip
- (35.47 KiB) Downloaded 408 times
-
X-ray
- Newbie
- Posts: 27
- Joined: Fri Apr 16, 2010 12:00 am
Post
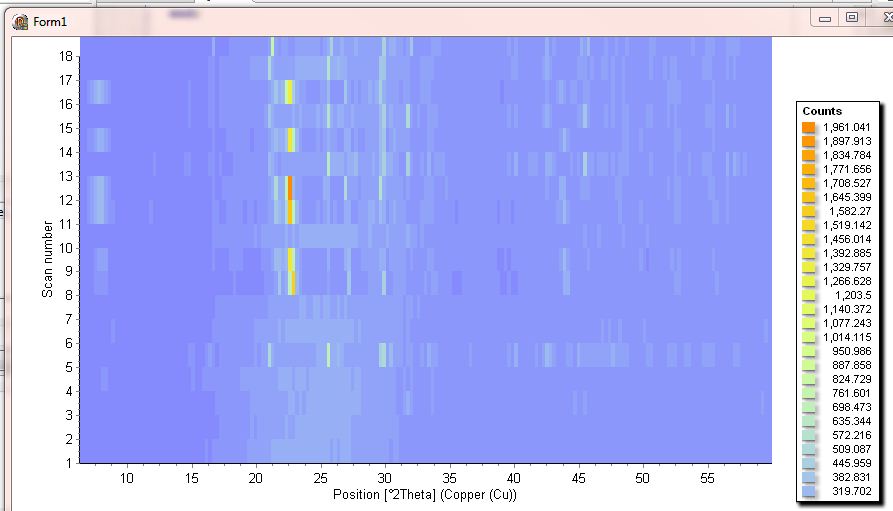
by X-ray » Wed Sep 15, 2010 11:13 am
Hi Yeray,
I think I have found the cause for the painting problem. For different series I am using different painters, for 3D surfaces I am using OpenGL and for the ColorGrid I am using GDI. When I am switching to the ColorGrid plot I am switching the Active property of TTeeOpenGL component to False. With the new TChart version this leaves the active Renderer still on OpenGL and no data is shown.
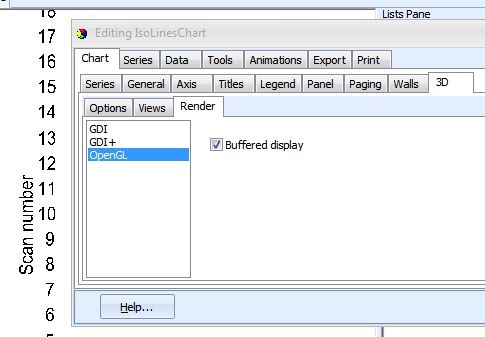
- Capture.JPG (33.12 KiB) Viewed 12129 times
When I select GDI in the chart editor form the ColorGrid displays nicely.
Here are my remarks/questions:
1) De-activating the OpenGL renderer should automatically activate the normal GDI rendering again (like in all old versions) and not show an empty screen.
2) How can I programmatically (in code) switch the chart painting back to GDI (as a workarround)?
best regards,
X-Ray
-
X-ray
- Newbie
- Posts: 27
- Joined: Fri Apr 16, 2010 12:00 am
Post
by X-ray » Wed Sep 15, 2010 12:40 pm
Hi Yeray,
for your convenience I have modidied the example application to show the problem.
Just press the button on the bottom that will switch the OpenGL component to active and the graphics dissapears (why anyway, is this another bug? ).
Then press the button again which switches the OpenGL component active property to False.
You will see that the graphics is still invisible unlesss you select the GDI renderer in the Chart editing form.
best regards,
X-Ray
-
Attachments
-
- ColorGridBugNew.zip
- (44.34 KiB) Downloaded 419 times
-
Narcís
- Site Admin
- Posts: 14730
- Joined: Mon Jun 09, 2003 4:00 am
- Location: Banyoles, Catalonia
-
Contact:
Post
by Narcís » Fri Sep 17, 2010 8:41 am
Hi X-Ray,
You didn't answer the question concerning the 3D alignment bug?
TV52014983 hasn't been fixed yet and I can't think of a workaround for now.
The graphics extends beyond the Y axis (you can see that by loading the attached .tee file):
This can be solved setting ClipPoints to true:
1) De-activating the OpenGL renderer should automatically activate the normal GDI rendering again (like in all old versions) and not show an empty screen.
I'm afraid this is a bug which I have added to the defect list with ID. TV52015159.
2) How can I programmatically (in code) switch the chart painting back to GDI (as a workarround)?
You can set chart's canvas back to the default canvas which is TTeeCanvas3D, for example:
Code: Select all
Uses TeeStore, TeCanvas;

procedure TForm1.Button1Click(Sender: TObject);
begin
  TeeOpenGL1.Active := not TeeOpenGL1.Active;
  if TeeOpenGL1.Active then
    Button1.Caption := 'OpenGL Active = True'
  else
  begin
    Button1.Caption := 'OpenGL Active = False';
    IsoLinesChart.Canvas:=TTeeCanvas3D.Create;
  end;

 IsoLinesChart.Repaint;
end;
-
X-ray
- Newbie
- Posts: 27
- Joined: Fri Apr 16, 2010 12:00 am
Post
by X-ray » Fri Sep 17, 2010 9:22 am
Hi Narcis,
>TV52014983 hasn't been fixed yet and I can't think of a workaround for now.
This is a big problem, we going to release a new version of our SW package soon. And now it seems like I have to redo all modifications
and go back to a previous (working) TChart Version (8.06).....
Another question was why the graphics dissapears (the axes are still shown) when I switch to OpenGL mode?
best regards,
X-Ray
-
Narcís
- Site Admin
- Posts: 14730
- Joined: Mon Jun 09, 2003 4:00 am
- Location: Banyoles, Catalonia
-
Contact:
Post
by Narcís » Fri Sep 17, 2010 10:23 am
Hi X-Ray,
This is a big problem, we going to release a new version of our SW package soon. And now it seems like I have to redo all modifications
and go back to a previous (working) TChart Version (8.06).....
Ok, I have increased TV52014983's priority to be fixed ASAP.
Another question was why the graphics dissapears (the axes are still shown) when I switch to OpenGL mode?
This is because the chart is in 2D mode, code below does the trick.
Code: Select all
procedure TForm1.Button1Click(Sender: TObject);
begin
  TeeOpenGL1.Active := not TeeOpenGL1.Active;
  if TeeOpenGL1.Active then
  begin
    IsoLinesChart.View3DOptions.ZoomFloat:=100;
    IsoLinesChart.View3D:=True;
    Button1.Caption := 'OpenGL Active = True'
  end
  else
  begin
    Button1.Caption := 'OpenGL Active = False';
    //Workaround
    //IsoLinesChart.Canvas:=TTeeCanvas3D.Create;
  end;

 IsoLinesChart.Draw;
end;
-
X-ray
- Newbie
- Posts: 27
- Joined: Fri Apr 16, 2010 12:00 am
Post
by X-ray » Wed Oct 06, 2010 9:32 am
Hi,
do I see this right, both bugs TV52014983 and TV52015159 are not fixed in the
new maintenance release TeeChart v2010.01.11004 VCL and there is no workarround
for bug: TV52014983 ?
This means we can not use version 9.0 in our product.
best regards,
X-ray


