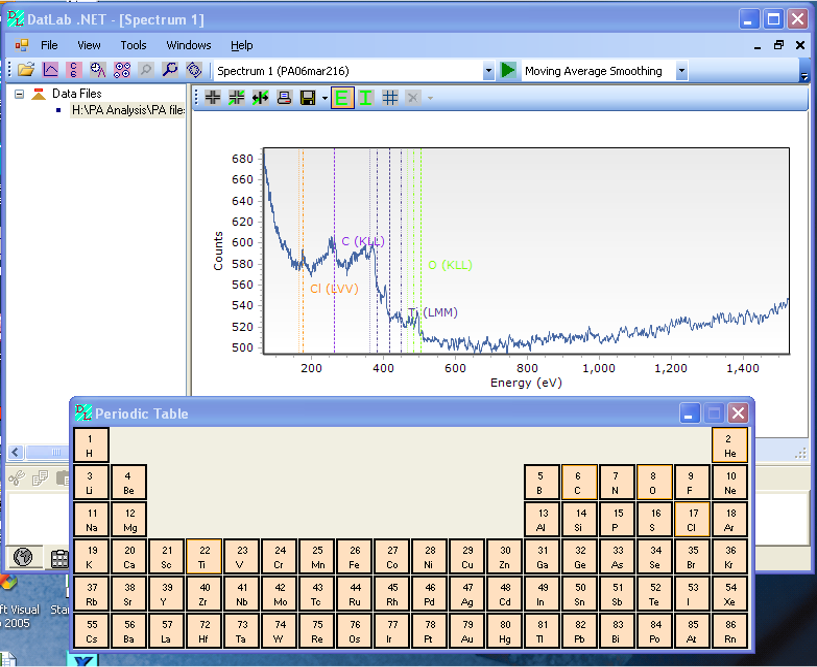
About ShimadzuShimadzu Research Laboratory (Europe) Ltd was established in 1997 to perform R&D in core technology for our parent company, Shimadzu. Our branch of the company specialises in analytical instruments including mass spectrometry. Our parent company develops a wide range of instruments for a wide range of industries. The data can be complex so specialised software is required to analyse and visualise the data. Select Elements in Periodic table to display lines on the chart to mark element peak positions (each element has peaks at characteristic energies).
Lines of the characteristic peaks have different colours with different line types for different transition types (transitions from different elemental orbitals).
The element labels on the chart have the same colour as the lines.
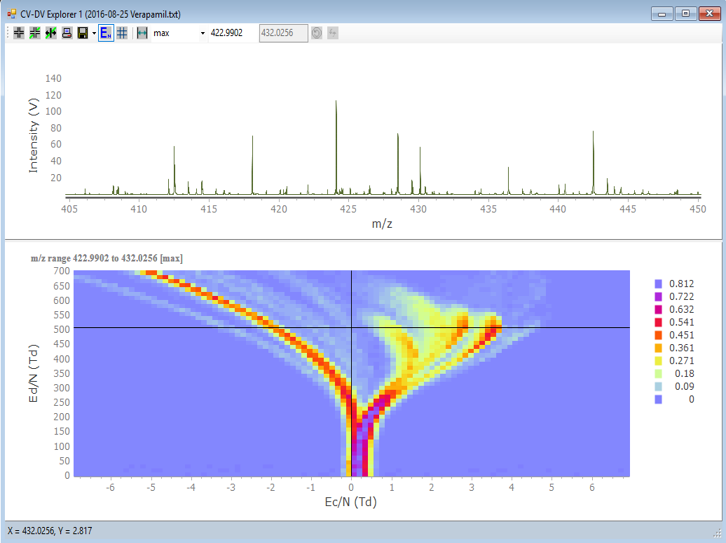
Describe your ApplicationOne application analysed the data collected to identify the elements present in a sample for a surface science instrument. The instrument measures intensities over a range of energies, and the energy position of the peaks is characteristic of particular elements. Generally our data is spectral data, but this can be measured along a vector (line scan), or over an area (spectrum image). So we can have large amounts of data in a single file.Why did you choose TeeChart?We have used TeeChart for a wide range of applications since 2004. We prototyped with a number of controls and checked them all for the features that we required. The TeeChart for C++ had a good range of built in properties and events which covered our main requirements, and it also offered the ability to customise and extend many properties and events quite easily. The documentation and support forum is also very useful. TeeChart is therefore very flexible, and is also available for a variety of development environments. We have since upgraded to TeeChart for .NET.Describe a specific project challenge your company overcame using TeeChartWe had to represent different types of data, raw, and smooth, peak positions, different lines for different elements. Ability to adapt the component to different projects. Built own wrapper functions around it to create a user interface class, and a Chart control object to control multiple charts in multiple dialogs.What benefits have you experienced from using TeeChart?Benefits are that behaviour for 1 data type can be reused for another, saving development time. For spectral data we can easily display different spectra on 1 chart for comparison. Very easy to zoom and pan around the chart, also good selection of cursor behaviours to choose from means that we can have different ways to select data for spectral (1D) and image (2D) data.Dr Jennifer Broughton Research Software Engineer & Data Analyst Shimadzu Research Laboratory (Europe) Ltd www.shimadzu.com www.srlab.co.uk 
|

