Tutorial 1 - Getting Started
Getting Started - building Charts and populating Data Series Contents
Introduction
Building a Chart
Including TeeChart on a Form
The Chart Editor
The Chart Series Gallery
Populate the new data Series
ADO.NET
Coded data input
Selecting a Series type to suit your needs
Introduction
Basic Charts can be built and implemented using the TeeChart Editor with little or no use of code. The TeeChart Editor is two Editors in one, as the Chart may be thought of as being distinct from its data Series contents. You may define the Chart appearance, titles, Legend characteristics and 3D aspect without having to include a data Series. That gives you the freedom to add and remove different data Series types at runtime without having to redefine the whole Chart look and feel. 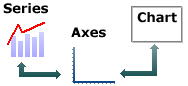
These components work together, with Chart axes being the interface between Chart and Series. A Series has data and its values will influence the label characteristics of the Chart axes. The axes appearance, colours, grid frequency and label fonts may all be defined for the Chart before adding data Series. TeeChart will make a best estimate of most values to minimise the need for you to predefine Chart and Series properties.
Add multiple series types with the Chart editor: The "Chart distinct from Series" design paradigm of TeeChart allows you to mix a variety of Series types without being limited to a choice of predefined Chart formats.
And Internet ! TeeChart Pro .Net is fully compatible with ASP.NET, being able to be placed on an ASP.NET WebForm and edited at design time in a completely WYSIWYG fashion. You may choose the type of image format outputted at runtime from the list of those available: JPEG, GIF, PNG, TIFF, BMP and EMF. See the Internet applications tutorial for more information.
The steps in this tutorial highlight how easy it is to build a Chart from scratch and will introduce you to the TeeChart Editor to enable you, through later tutorials, to modify and further enhance the appearance and functionality of the Chart. Good Charting !!
Building a Chart
Including TeeChart on a WinForm By using TeeChart's installer application you will have succeeded in adding the TeeChart icons to the Toolbox of the Visual Studio .Net programming environment.
The TeeChart Chart icon is a representation of a circled (Pie) Chart.

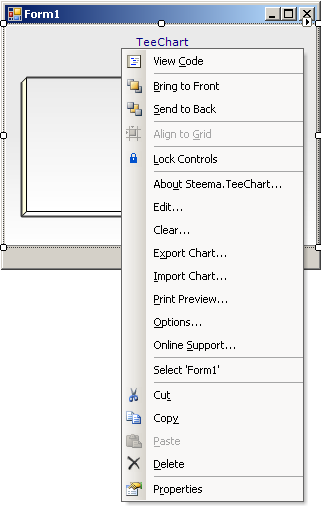
Select the icon in the Toolbar and click and drag out to size TeeChart on a Form. You will see TeeChart as a panel with some basic Chart features such as Axis and Title. TeeChart is much more than a panel of course; right click on the new TeeChart and you will see a menu displayed. Select the Edit... option to access the TeeChart Editor.
For an introduction to TeeChart's other palette components, follow this link to Tutorial 16.
The TeeChart Editor
The TeeChart Editor contains access to most commonly used, Chart properties.
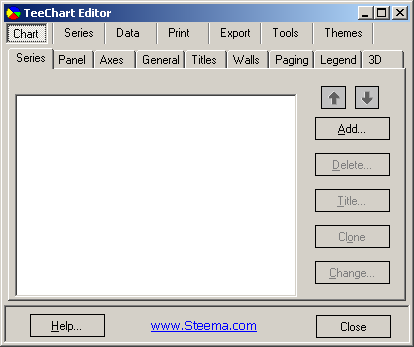
To add a new Series mouseclick on the Add... button and select the Series type from the Series Gallery. If, after selecting a Series type now, you wish to change it later you may do so (with a few exceptions where Series data content may be incompatible) by returning to the first Editor screen and selecting the Change... button.
The Chart Series Gallery
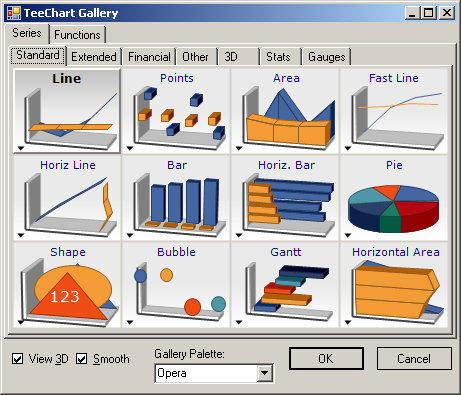
The Series Gallery consists of eight tabbed pages:
 Standard
 Standard Series types, those likely to be called upon most frequently, e.g. Line, Bar, Pie, etc.
Extended Extended Series types, include more specialized Series types for planning or mapping applications, e.g. Arrow, Polar, Org Charts, Bezier, etc.
Financial Financial Series include more specialised Financial Series types for financial applications.
Other If you still haven't found the Chart type you are looking for, you're likely to find it here, e.g. Tag Cloud, Wind Rose, Calendar, etc.
3D 3D Series include Series types which offer a 3 dimensional representation e.g. Surface, Waterfall, Tower, etc. These types take three (X, Y, Z) rather than two (X, Y) variables.
Stats Stats Series include Chart Series types for statistical applications, e.g. Histogram, Error Bar, BoxPlot, etc.
Gauges Guage Series offer a variety of Guages such as Numerical, Linear, Cirular, etc.
Maps Map Series include a variety of Maps for geographical Charts e.g. World, Europe, North America, Asia, etc.
Select a Series type. For this exercise we will choose a Bar Series type. The Gallery will close and the new Series will be displayed in the first Chart Editor screen.
Populate the new data Series
Select the Series tab in the Chart Editor to display the Series configuration properties. The fourth tab on the Series page is the the data source tab. ADO.NET
If your data source is ADO.NET compliant then you may map your data directly in the Chart editor.
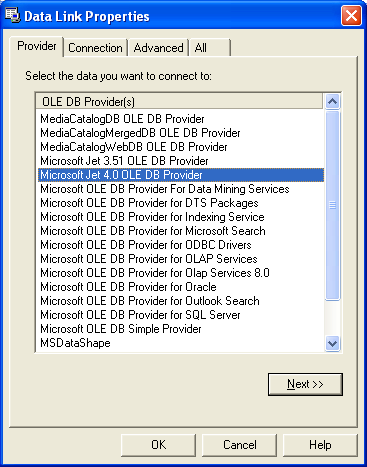
In this example we are going to connect a BarSeries to the TeeChart.mdb Access database. First, from the Data tab of the VS.NET ToolBox, drag a OleDbDataAdapter onto a WinForm with a TeeChart for .Net object on it. Click "Next" on the Data Adapter Configuration Wizard and on the next page click on the "New Connection..." button. Now click on the "Provider" tab of the new window and select "Microsoft Jet OLE DB Provider" as in the image below:
(*please note - the appearance of the Wizard varies slightly between frameworks)
Now click on the "Connection" tab of the same window and select the TeeChart.mdb file from the Sample Data folder under the TeeChart for .Net root directory:
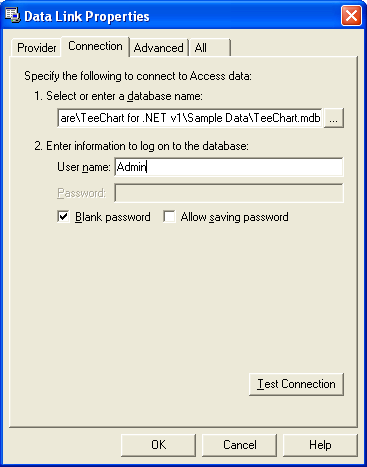
Click on the "Test Connection" button to test the connection and then click on the OK button of the same window. Now click on the "Next" button of the Data Adapter Configuration Wizard window, select "Use SQL Statements" from the window that appears and click on the "Next" button again. Now click on the "Query Builder" button and add in the "Employee" Table. Close the "Add Table" window and select the "*(All Columns)" CheckBox:
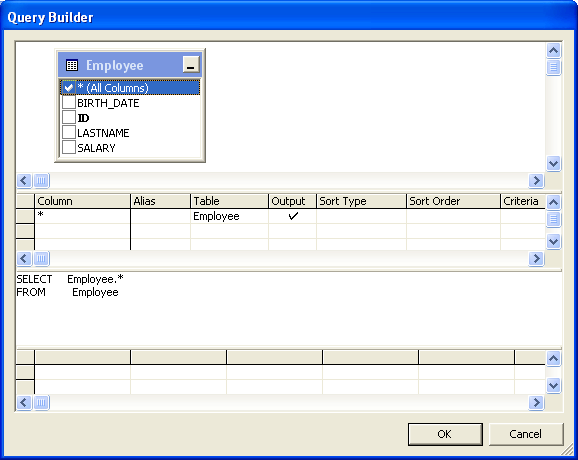
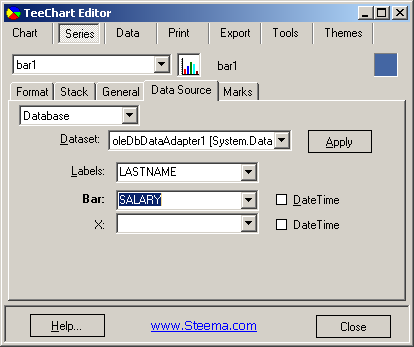
Now OK this window, click on "Next" and then "Finish". Now open the TeeChart Editor, add in a BarSeries and navigate to the DataSource tab of the Series tab. Select "Database" from the ComboBox and oleDbDataAdapter1 [System.Data.OleDb.OleDbDataAdapter] from the DataSet ComboBox. Set Labels to "LASTNAME" and Y to "SALARY" as in the image below:
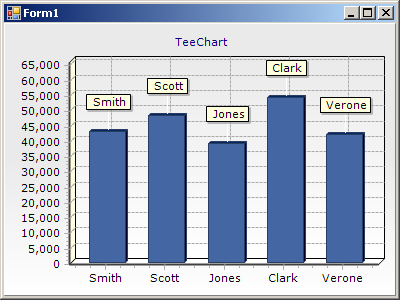
Now click on the Apply button and run the form; you should now have something like the following:
For more information, please see Tutorial 8 - ADO.NET Database Access.
Coded data input
For programmed input of data you will need to write some code. This section will show you the steps necessary to build a chart with coded input.
The Series that you previously added with the Chart Editor shows random data at design time. At runtime however, the Series will be empty of data unless you manually populate it. Select a Button from the Toolbox and place it on your Form. In Visual Studio .Net, double-click on the Button to access the code editor (the approach may vary in different programming environments).
In the code Editor type these lines:
[C#.Net]
private void button1_Click(object sender, System.EventArgs e)
        {
            bar1.Add(3,"Pears",Color.Red);
            bar1.Add(4,"Apples",Color.Blue);
            bar1.Add(2,"Oranges",Color.Green);
        }
[VB.Net]
Private Sub Button1_Click(ByVal sender As System.Object, ByVal e As System.EventArgs) Handles Button1.Click
        Bar1.Add(3, "Pears", Color.Red)
        Bar1.Add(4, "Apples", Color.Blue)
        Bar1.Add(2, "Oranges", Color.Green)
End Sub
Run the project and press the Button. Three new bars will appear on your Chart. That's it!! There's no more to it.
The first Bar Series in your Chart is called Bar1, the second Bar2 etc.. so with multiple series in your Chart you may use these names to modify the relevant Series.
The Series' Add method has 25 overloads, the 7th of which accepts 3 variables, Value, Text and Colour. The Add method thus assumes equal spacing of values on the Label axis (in this case the X-Axis). If your data contains 2 variables you may use another of the Add method's overloads. Add another Button to your project and put this code in it. Run the Project and add points using this code:
[C#.Net]
private void button2_Click(object sender, System.EventArgs e)
        {
            Random rnd = new Random();
            if(bar1.Count > 0)
            {
                //Increment X Axis value and add a new random point
                bar1.Add((bar1.XValues.Last + rnd.Next(10)), ((bar1.YValues.Last/(bar1.YValues.Last - 1)) + rnd.Next(10)),"Lemons",Color.Yellow);
            }
            else
            {
                //Add a new random point
                bar1.Add(1,rnd.Next(10),"Lemons",Color.Yellow);
            }
        }

[VB.Net]
Private Sub Button2_Click(ByVal sender As System.Object, ByVal e As System.EventArgs) Handles Button2.Click
        Dim rnd As Random
        If (Bar1.Count > 0) Then
            'Increment X Axis value and add a new random point
            Bar1.Add((Bar1.XValues.Last + rnd.Next(10)), ((Bar1.YValues.Last / (Bar1.YValues.Last - 1)) + rnd.Next(10)), "Lemons", Color.Yellow)
        Else
            'Add a new random point
            Bar1.Add(1, rnd.Next(10), "Lemons", Color.Yellow)
        End If
End Sub
Selecting a Series type to suit your needs
The last coded example generated new X and Y values. The X axis distance between points is not constant which will cause overlapping of Bars in some cases, which would be desirable for some but not all applications. Using the Chart Editor to Change the Series type (Enter the Chart Editor at Design time and use the Change button on the first page, then change all references to Bar1 in your code to Line1) to a LineSeries shows an alternative way to graphically represent data with 2 variables. If your data contains more than 2 variables there are other Series Types suited to displaying the data. Have a look at the Chart Gallery to select the Series type you think might serve you best then read about it in the TeeChart help.