The Firemonkey Canvas is fast but there is a performance problem when drawing lots of elements (“lots” being in the order of tens of thousands).
Using a TPath, adding all the elements to it and then drawing the TPath gives some speed gains but it is not enough. Time is lost filling the TPath anyway.
If the elements are simple lines, graphical apis like Direct2D or GDI+ have optimized shortcuts that run much quicker than drawing single lines many times.
Using simple rtti “hacks”, TeeChart “FastLine” series style is now twice as fast when there are a lot of points to display.
The gains are aprox 2x (twice the speed). It all depends on the combination of cpu + gpu + chart size + number of points.
This improvement will be included in the next coming update release.
There are some conditions to use this fast technique:
// All points in the series are painted as one big line, instead of multiple segments
Series1.DrawStyle := TFastLineDrawStyle.flAll;
// "null" (empty) values, if they exist, should be ignored (no gaps in the line)
Series1.TreatNulls := TTreatNullsStyle.tnIgnore;// Tell canvas to use faster speed:
Series1.FastPen := True;Performance gain, from 19 frames-per-second to 38:
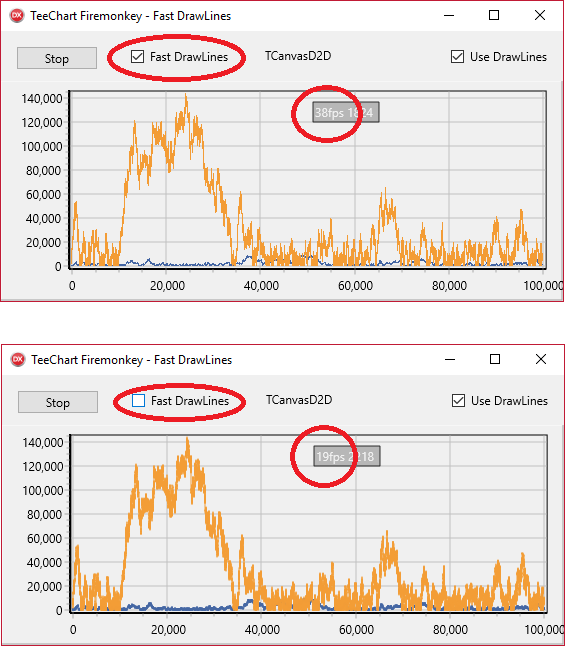
The picture above shows 2 FastLine series, with 100.000 points each running on Windows.
GPU Canvas:
Unfortunately, there is no shortcut for a similar method in the TCanvasGpu (used on Android and iOS platforms).
Trying to simplify the StrokeBuild and FillTriangles methods for this case (lots of lines) gives only aprox a 10% speed improvement.
About reducing the number of points:
Its clear it is better not to add that quantity of points to the series, as there are not enough pixels to display them, but in some applications (specially when the data comes more or less in realtime) reducing the number of points can cost more time depending on the algorithm.
FastLine provides a basic point-reducer mechanism using a property:
Series1.DrawAllPoints := False;
Series1.DrawAllPointsStyle := TDrawAllPointsStyle.daFirst; // use first Y for all common X
And also : “daMinMax” to draw vertical lines for points with repeated “X” coordinates.
TeeChart Pro version includes more advanced ways to do data-reducing at the TeeDownSampling.pas unit.
A TDownSamplingFunction can be used at design-time or run-time using several algorithms (including Douglas-Peucker Polygon Simplification) :
TDownSampleMethod=(dsDouglas, dsMax, dsMin, dsMinMax, dsAverage,dsMinMaxFirstLast, dsMinMaxFirstLastNull);TeeFunction1.DownSampleMethod := TDownSampleMethod.dsDouglas;Series2.FunctionType := TeeFunction1; // <-- Series2 will contain the "reduced" data
Series2.DataSource := Series1; // <-- Series1 has many points