Introduction
Connecting a TeeChart control to MySQL database at design-time using the TeeChart Editor and at run-time.
The sourcecode for this demo is available via this github resource:
https://github.com/Steema/TeeChart-for-.NET-CSharp-WinForms-samples/tree/master/ConnectingToMySql
It assumes that you have a later version of TeeChart for .NET installed in your machine. You can use a TeeChart evaluation version if you don’t have the registered version to hand. See this page: https://www.steema.com/downloads/net
Example 1. Connecting to MySQL at design-time
MySQL Driver
- Download and install the MySQL Driver from https://dev.mysql.com/downloads/connector/odbc/
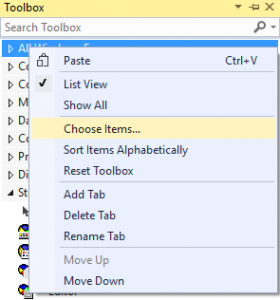
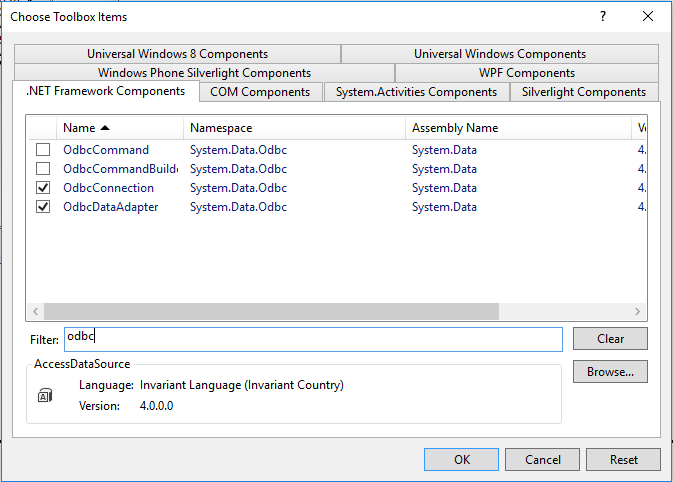
- Add the OdbcConnection and the OdbcDataAdaptar to the ToolBox.
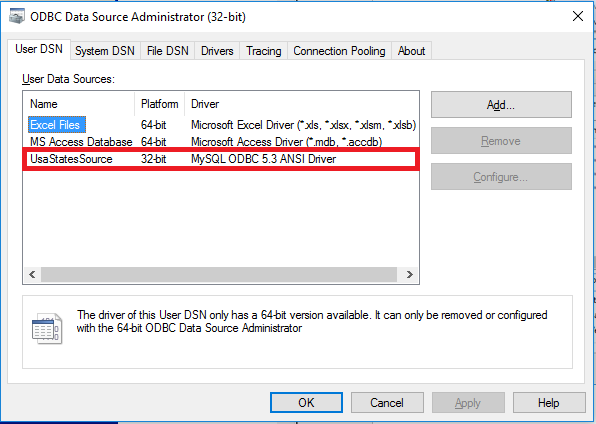
- Create a new user or system data source using ODBC Data Sources (32bits/64bits).
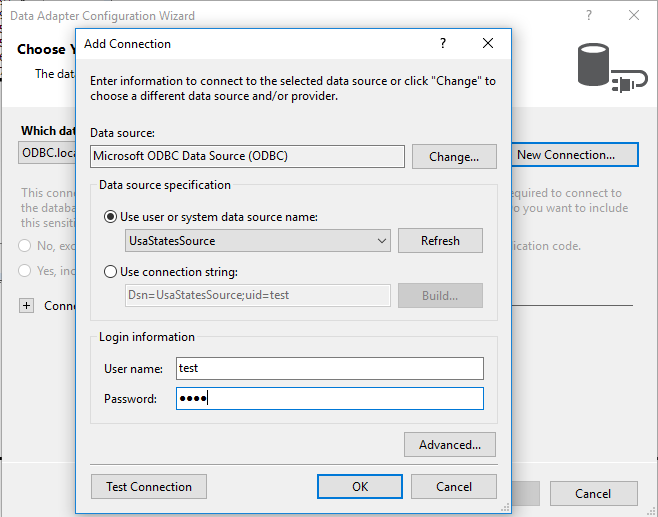
- Drag an OdbcDataAdapter onto a WinForm with a TeeChart for .NET object on it. Add a New Connection on the Data Adapter Configuration Wizard.
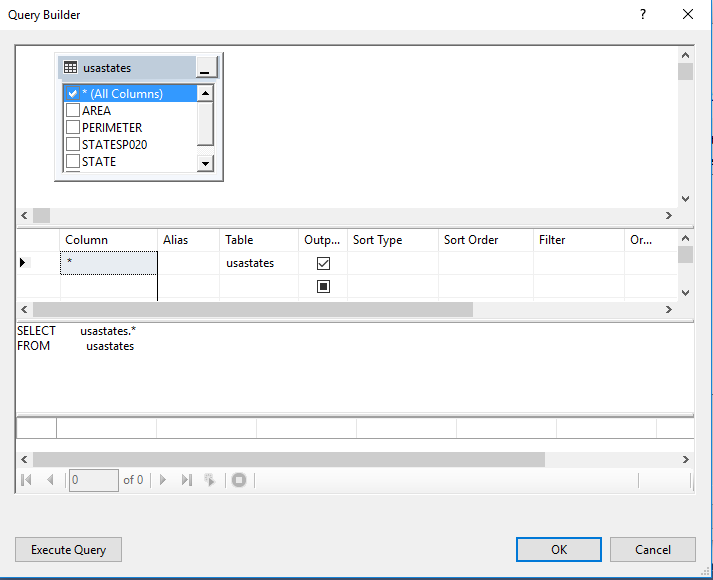
- Now click on the “Query Builder” button and add in the “usastates” Table. Close the “Add Table” window and select the “*(All Columns)” CheckBox:
- Click “Ok”, “Next” and “Finish”.
- Assuming you have placed a TeeChart on a form, now open the TeeChart Editor and add a new Series.
- Click on the “Series” tab and choose the data that you wish to plot. In this case, select “Database”, choose the Dataset previously created and select the data that you want to use.
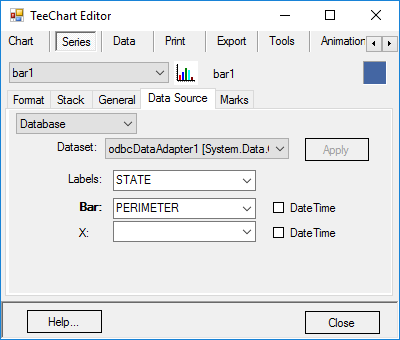
- Click “Apply”. You should now have something like the following in the design-time:
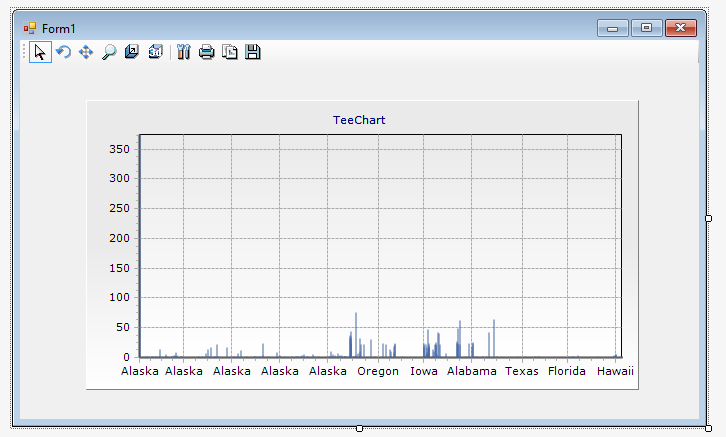
- Add the following line of code to apply the changes in design-time of the chart when you execute the form:
tChart1[0].CheckDataSource();This demo has loaded data into a TeeChart Bar Series as a test exercise. The data plotted in this way generated a simple chart based on Perimeter values for states in the USA. Whilst the exercise has been of interest as a generic exercise, the datasource content itself leads us on to the second exercise which will use the data from the source in a more suitable manner. The data is ESRI shapefile map data and for the second exercise we’ll plot it as a map.
Example 2. Connecting TeeChart to a MySQL datasource at runtime
For this part of the exercise we’ll use an ESRI shape file to load a world map into TeeChart. TeeChart already has its own map resources so loading this map isn’t strictly necessary to be able to view a World Map series, but as the ESRI shapefile format is widely used (see this document for some specification details: https://www.esri.com/library/whitepapers/pdfs/shapefile.pdf) the example may be useful to help you to plot your own shapefile data.
- Select the TChart component from the Toolbox and drag it onto your form.
- Select an ODBCAdapter component and an ODBCConnection component and place them on your form. You can use the component wizards to connect to you datasource. For the purpsoses of our exercise it will generate code similar to the following code:
// odbcDataAdapter1

//

this.odbcDataAdapter1.SelectCommand = this.odbcSelectCommand1;

this.odbcDataAdapter1.TableMappings.AddRange(new System.Data.Common.DataTableMapping[] {

new System.Data.Common.DataTableMapping("Table", "Table", new System.Data.Common.DataColumnMapping[] {

new System.Data.Common.DataColumnMapping("CODE", "CODE"),

new System.Data.Common.DataColumnMapping("CNTRY_NAME", "CNTRY_NAME"),

new System.Data.Common.DataColumnMapping("POP_CNTRY", "POP_CNTRY"),

new System.Data.Common.DataColumnMapping("CURR_TYPE", "CURR_TYPE"),

new System.Data.Common.DataColumnMapping("CURR_CODE", "CURR_CODE"),

new System.Data.Common.DataColumnMapping("FIPS", "FIPS")})});

//

// odbcSelectCommand1

//

this.odbcSelectCommand1.CommandText = "SELECT   world.*\r\nFROM       world";

this.odbcSelectCommand1.Connection = this.odbcConnection1;

//

// odbcConnection1

//

this.odbcConnection1.ConnectionString = "Dsn=world_map;uid=flute_16_r;";
We have used a test database configured on a MySQL server at db154.pair.com:
Database Name=flute_examples; Username=flute_16_r, Password=P2TXnnjs. We’ll be keeping this database active for some time into the future so you can run your test project to it if you like.
- We’re loading the data to the project from an ESRI shape file and using the database to source value-add data such as country names.
The following code run at form_load time, loads the chart and a datagridview that accompanies the chart on the form.
public Form2()
{
InitializeComponent();
TeeSHP teeSHP = new TeeSHP();
odbcDataAdapter1.Fill(dataSet1);
teeSHP.LoadMap(map1,Path.GetFullPath(Path.GetDirectoryName(Application.ExecutablePath) + "..\\..\\..\\Maps\\world.shp"), dataSet1.Tables[0], "CNTRY_NAME", "POP_CNTRY", null, null);
this.dataGridView1.DataSource = dataSet1.Tables[0];
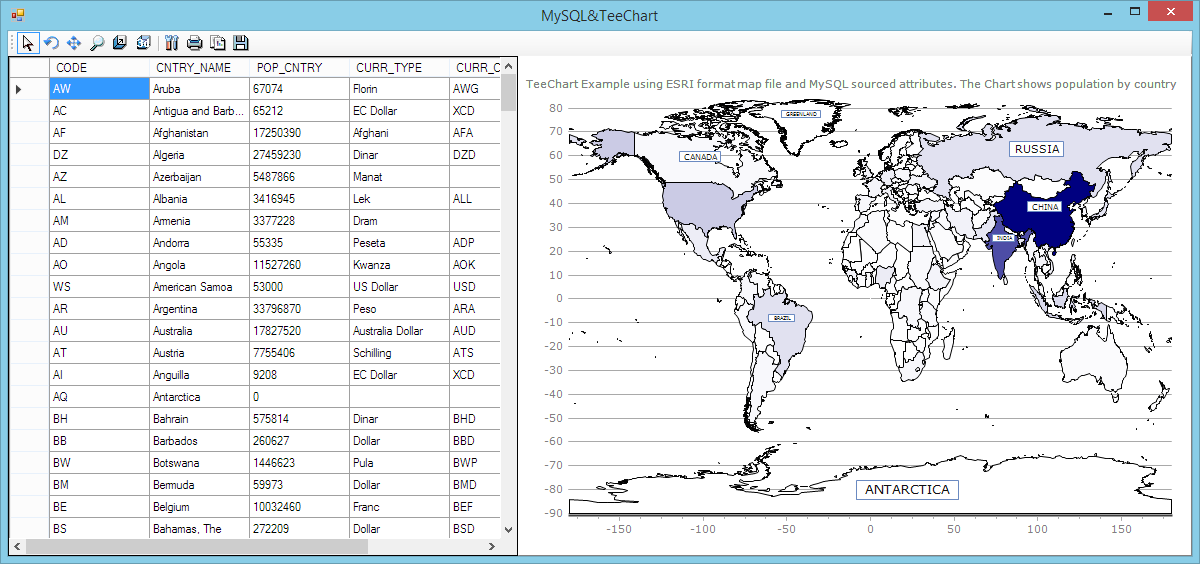
}You’ll see we’re using two fields for highlighting in the chart. The map will use the country names (CNTRY_NAME) as label and will use the country population figures (POP_CNTRY) to colourcode each country according to its population ranking.
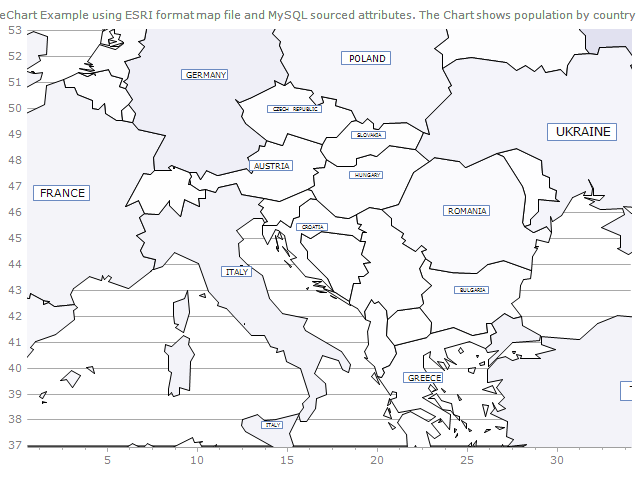
- When you run the project you should see the data loading into the chart as a world map with colourcodings to represent the relative population figures by country. We’ll activate the Marks by code at form load time to display the country labels on each country.
private void Form1_Load(object sender, EventArgs e)
{
  tChart1[0].Marks.Visible = true;
}
When running the application you should see the above result. Notice that the country names are not visible on all countries; that’s because the label autosizes and if it’s considered that the text is too small to read the label isn’t plotted. Auto-sizing can be disabled or simply zoom the map over the country to see the label displayed.
Example below:
That’s all from the demo project, we hope you may have found it of interest!