Steema is pleased to inform you of the availability of the latest TeeChart for JavaScript 2024.06.27.3.1 release.
Steema is pleased to inform you of the availability of the latest TeeChart for JavaScript 2023.05.02.3.0 release.
Steema is pleased to inform you of the availability of the latest TeeChart for JavaScript 2022.09.26.2.9 release.
Announcing the release of the TeeChart for Javascript’s ES6 encoded version.
Steema is pleased to inform you of the availability of the latest TeeChart for JavaScript 2021.04.26.2.7 release.
Steema is pleased to inform you of the availability of the latest TeeChart for JavaScript 2020.05.27.2.6 release.

Steema is pleased to inform you of the availability of the latest TeeChart for JavaScript 2018.07.09.2.5 release.

Steema is pleased to inform you of the availability of the latest TeeChart for JavaScript 2018.02.16.2.4 release.
Steema is pleased to inform you of the availability of latest TeeChart for PHP v2018.01.16.000 release.

Steema is pleased to inform you of the availability of the latest TeeChart for JavaScript 2018.01.04.2.3 release.
Steema is pleased to inform you of the availability of latest TeeChart for JavaScript 2017.11.17.2.2 release.

Steema is pleased to inform you of the availability of latest TeeChart for JavaScript 2017.10.19.2.1 release.
Steema is pleased to inform you of the availability of latest TeeChart for JavaScript v2017.07.12.2.0 release.
Steema is pleased to inform you of the availability of latest TeeChart for PHP v2017.04.24.000 release.
Steema is pleased to inform you of the availability of latest TeeChart for JavaScript v2017.04.26.1.9 release.
Announcing a new version Update to resolve Compatibility issues for recent versions of WebGL.

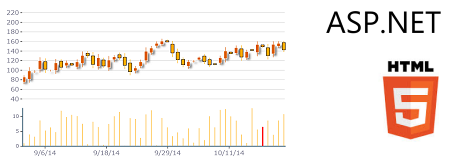
Now you can combine your server-side NET projects with client-side HTML5 Javascript, live at the browser. The latest TeeChart for .NET update, expected for release during the second week of August, includes WebForm designtime editable charts with rendering as live HTML5-Javascript browser-side charts. The charts are fully interactive and may be configured via C# code-behind at the server or browser-side directly on the webpage in Javascript.
Steema is pleased to announce the availability of the TeeChart for JavaScript / HTML5 v2014.07.31.1.7 maintenance release.
Announcing the availability of the TeeChart for JavaScript v2014.04.28.1.6 maintenance release.
Steema is pleased to announce the availability of the TeeChart for JavaScript v2013.10.22.1.5 maintenance release.
Steema is pleased to announce the availability of the TeeChart for PHP 2013.07.16.003 maintenance release.
Steema is pleased to announce the availability of the TeeChart for PHP v2013.07.04.002 maintenance release.
The TeeChart for .NET Chart for Windows Phone is now available for Windows Phone 8. The current version of TeeChart for .NET includes Chart, Map and Gauge examples for the Windows Phone environment. That adds great reach for your C# charting code. We thought it's be a good moment to review options.
This is to inform you that there is a new update of the TeeChart Javascript Chart for HTML5 available for download. The HTML5 Chart includes several new features and some minor bugfixes. View the
product release notes for more information.
New release is now available for the Licensed Pro version of the Charting component library for PHP development.
Now available, the download of the new update of the TeeChart Javascript Chart for HTML5 Charting library.
Server Mobile Application Business Charting with TeeChart Lite for HTML5 Builder
David Intersimone's Embarcadero blog
http://blogs.embarcadero.com/davidi/2012/10/22/4186
Steema is pleased to announce the availability of the full version of
TeeChart for Javascript / HTML5 for Embarcadero HTML5 Builder.
Just to let you know there's a new update of the TeeChart Javascript Chart for HTML5 available for download. The HTML5 Chart includes several new features and some minor bugfixes. See the
product release notes for more information.
Steema has announced the availability of TeeChart Google Gadget.
Steema has announced the availability of the TeeChart plugin for Joomla v1.5 and v2.5.
Steema Software has announced the availability of the TeeChart plugin for Drupal.
Steema has announced the availability of the TeeChart plugin for WordPress.
| Announcing the release of the new TeeChart for Javascript HTML5 Charting Library! TeeChart's Chart for Javascript is written in 100% Javascript to support the HTML5 Canvas. The new release includes support for several key data visualisation series types and offers several tools for interactivity to enhance the Chart user experience. See the demo here. |
 |
The Charting library is offered free of charge for non-commercial use and as a fee-based commercial license where required. It may be used as an entirely standalone Javascript library but we are working too, to introduce the same animated Javascript/HTML5 model as an export format across the breadth of TeeChart products for the near-term future.
This demo Chart is javascript code-rendered using the html5 canvas.
Steema Software is pleased to present the full preview demo of the TeeChart for Javascript Charting Component Library.
Here's a preview of the new TeeChart native HTML5 Chart. The new chart is written using the HTML Canvas in 100% native Javascript. We expect to be able to make it available soon for integration with your development projects.
|
|
This demo Chart is javascript code-rendered using the html5 canvas.
 |
| (Zoom the Chart by left-mousebutton dragging right and down and unzoom by dragging up and left. Scroll by right-mousedragging over the Chart.) |
